
You can access all of our platforms from a single Saxo account.

US midterms: the options market expects a quiet Wednesday. What if it is wrong?

Summary: US voters go to the polls on 3 November 2026, and S&P 500 options price the result as only a little more eventful than an ordinary day. An iron butterfly and a long straddle take opposite sides of that calm.
Options price the vote at not much more than an ordinary day. How much protection does that buy, and what does it cost to bet against the calm?
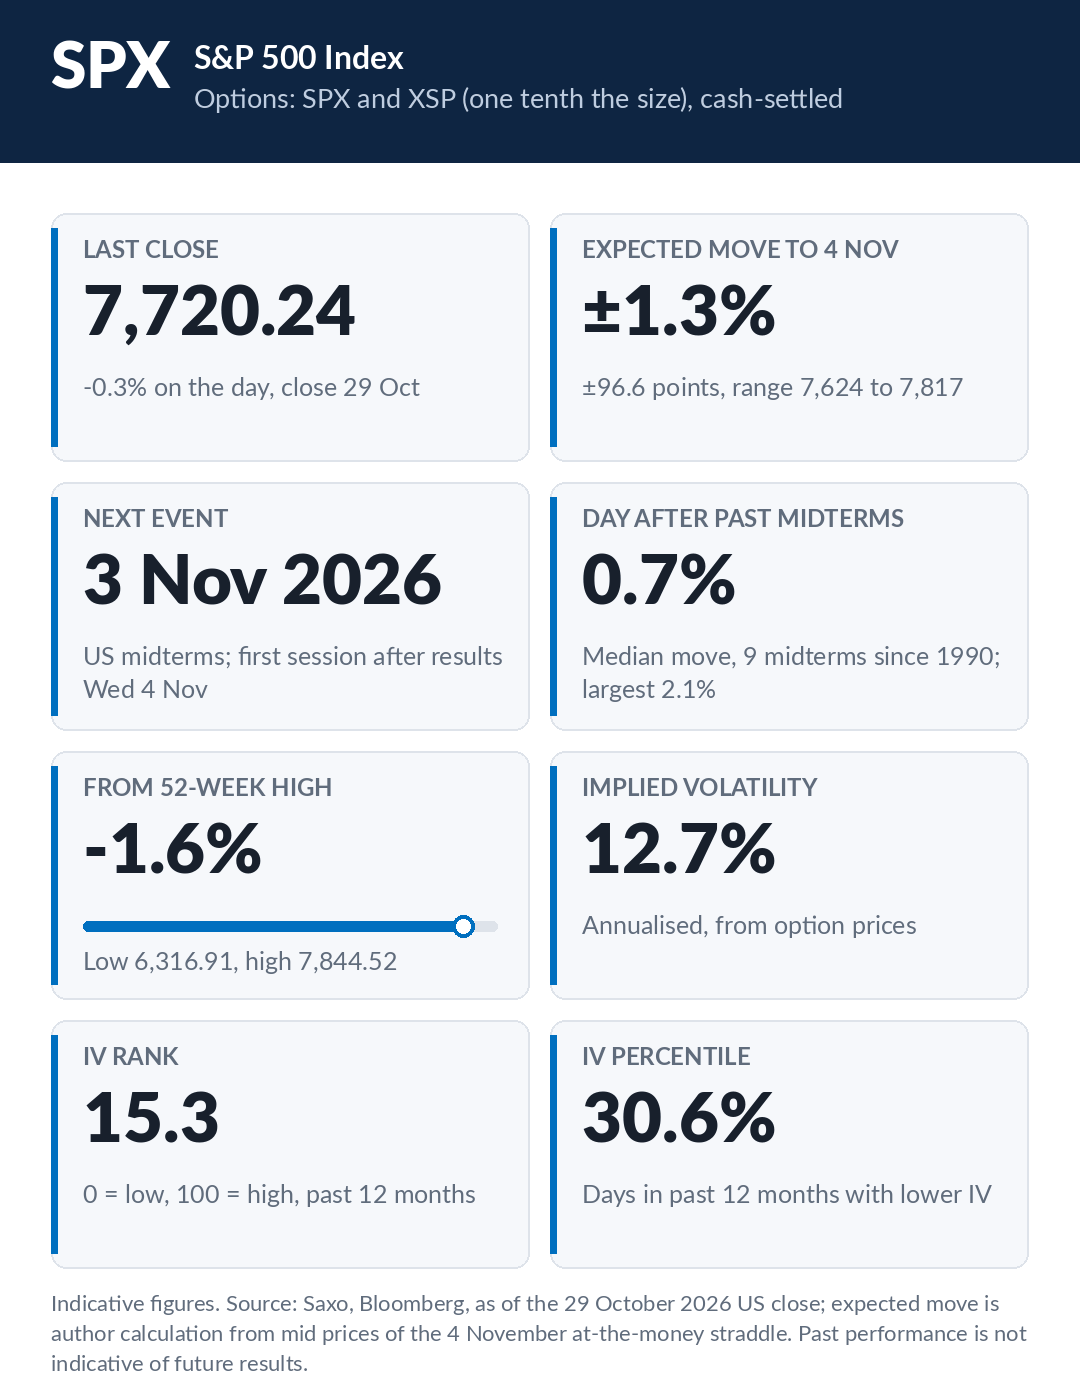 Key information on the S&P 500. Indicative figures. Source: Saxo, Bloomberg, as of 29 October 2026. Past performance is not indicative of future results.
US voters choose the whole House of Representatives and a third of the Senate on Tuesday 3 November. Most results come in overnight, so Wednesday is the first trading day that reacts. For a vote that decides who controls Congress for the next two years, the options market looks relaxed.
This article looks at how much S&P 500 options charge for the vote, how that compares with what the index did after earlier midterms, and what two opposite structures do with the price. Neither is a view on who wins. In our view, the size of the premium may matter more for an options trader than the outcome itself.
Important note: The strategies and examples provided in this article are purely for educational purposes. They are intended to assist in shaping your thought process and should not be replicated or implemented without careful consideration. Every investor or trader must conduct their own due diligence and take into account their unique financial situation, risk tolerance, and investment objectives before making any decisions. Remember, investing in the stock market carries risk, and it’s crucial to make informed decisions.
What the options charge for election day
A common way to read the move the market expects is to add up the price of an at-the-money call and put, known as a straddle. For the S&P 500, the options that expire on Wednesday price a move of about 1.3% in either direction by Wednesday’s close (Source: Saxo, Bloomberg, CBOE, 29 October 2026 close).
That covers the next four trading days, not only the vote. Comparing it with the options that expire a day earlier suggests, in our reading, that election night itself adds somewhat more than an ordinary day, but nowhere near twice a normal one. J.P. Morgan’s derivatives strategists made a similar point in September, when they noted that options priced the election much like a Federal Reserve meeting.
Volatility gauges tell the same story. At the 28 October close, the VIX measure that covers only the next nine days, election week included, sat below the usual 30-day VIX. If traders feared the vote, it would normally be the other way round. In our view, that suggests the market is charging more for the months after the election than for the election itself (Source: Saxo, Bloomberg, CBOE).
Three outcomes: AI spending against bond yields
On 29 October, prediction markets saw Democrats winning both chambers as the most likely result, at roughly two in three. A split Congress came next, and Republicans keeping both was the outside chance. On those prices the House looked close to settled and the Senate was the open question; the odds move daily.
Saxo’s Chief Investment Strategist, Charu Chanana, frames the vote through two things markets already care about: the AI build-out and bond yields. In her reading (Source: Saxo, October 2026):
- Split Congress: gridlock makes big spending, tax or regulatory changes harder to pass. That may keep bond yields steadier, which tends to help growth stocks, and could broaden gains beyond the largest AI names. She calls it possibly the most market-friendly outcome.
- Democrats win both chambers: the president keeps his veto, so current policy is unlikely to be reversed, but she expects "more oversight, more scrutiny, and more friction". For AI, the pressure point is the physical side: data centres, electricity demand, the grid and who pays for it. Spending may continue, only slower and costlier. Healthcare and parts of clean energy could benefit.
- Republicans keep both: policy continuity, easier permitting and support for energy and infrastructure, the most supportive outcome for data centres, utilities, power and grid equipment. The catch is borrowing: deficit and inflation worries could keep yields high, which she sums up as "good for AI earnings, but less comfortable for AI valuations".
Her conclusion is that the midterms may shape the market narrative but are unlikely to decide it on their own. The bigger question remains whether AI investment can keep delivering growth while yields stay high. In our view, that may be one reason the options are calm: the likeliest outcome is also the expected one, and a large index move would need a surprise.
What the index did the day after past midterms
Since 1990, the S&P 500 has typically moved less than 1% on the day after a midterm, close to what is priced now, and the VIX usually fell. Source: Saxo, Bloomberg, CBOE price history, author calculation. Past performance is not indicative of future results.
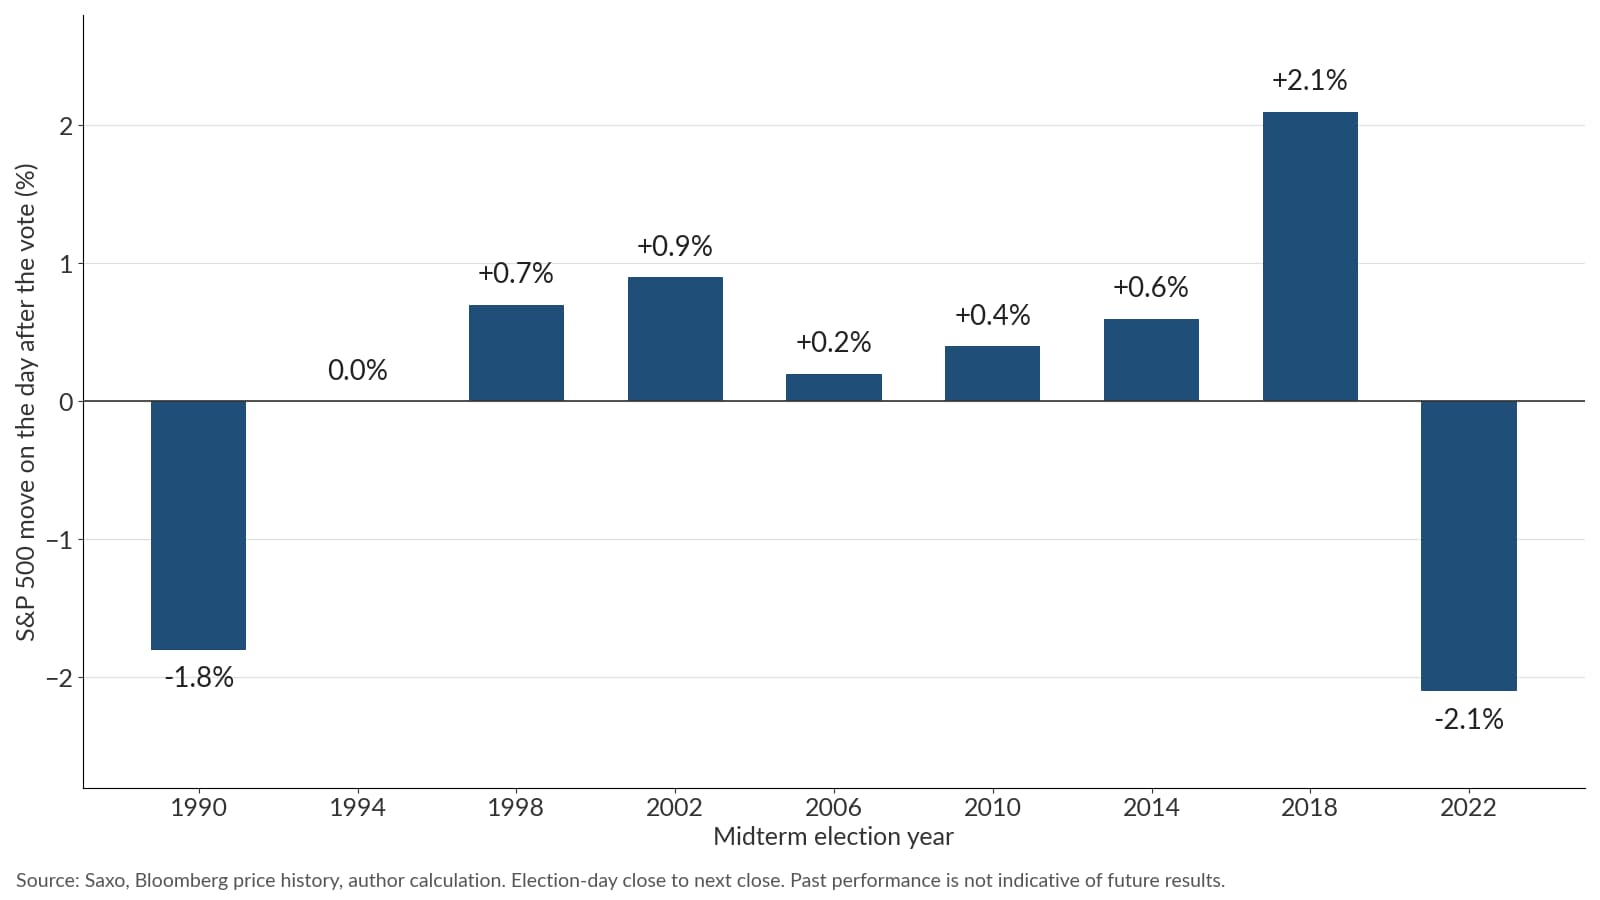 S&P 500 move on the day after each midterm election since 1990. Past performance is not indicative of future results; figures are illustrative and not predictive. Source: Saxo, Bloomberg price history, author calculation.
The two most recent votes were the exception. The index rose about 2% the day after the 2018 election and fell about as much after 2022, more than the move priced for the four sessions to Wednesday. Nine elections are a small sample, and each took place against a different backdrop.
Why Wednesday’s expiry, and how the strikes were chosen
Wednesday’s expiry is the first after the results, so it holds the reaction with the fewest other days attached. Friday’s expiry also includes the US jobs report, which mixes two events. A close Senate race could take days to call, so even Wednesday may not capture everything.
Both main examples use 7,720, the strike nearest the index at Thursday’s close. Index futures pointed lower before Friday’s open, so the index may start the day below that strike, and the prices in the examples reflect that. The iron butterfly’s protective wings sit 100 points either side, roughly the move priced for Wednesday. Wings closer in lower the maximum loss and the credit; wings further out do the opposite. All figures are hypothetical and for education only.
If the calm is right: an iron butterfly
The risk comes first: the maximum loss is reached if the index closes beyond either wing on 4 November. The structure gains most if the index finishes near 7,720, as the election premium tends to drain out of the options once results are known.
Example structure (illustrative only - not a trade recommendation)
- Sell 1 SPX 4 November 2026 7,720 call at about 33.55
- Sell 1 SPX 4 November 2026 7,720 put at about 67.35
- Buy 1 SPX 4 November 2026 7,820 call at about 5.45
- Buy 1 SPX 4 November 2026 7,620 put at about 28.45
- Net credit: about 67.00 points, 33.55 plus 67.35 from the short options, less 5.45 and 28.45 for the wings, or USD 6,700 per contract
- Maximum loss: about USD 3,300 per contract (hypothetical, for education only), the 100-point wing width less the credit, if the index closes beyond either wing
- Maximum profit: about USD 6,700 per contract (hypothetical, for education only), if the index closes exactly at 7,720
- Break-even at expiry: about 7,653 and 7,787, roughly 0.9% either side of the strike
- Costs and charges apply to each leg and vary by account and venue; check the applicable rates before entering any position.
- (Source: Saxo, indicative quotes before the US open on 30 October 2026)
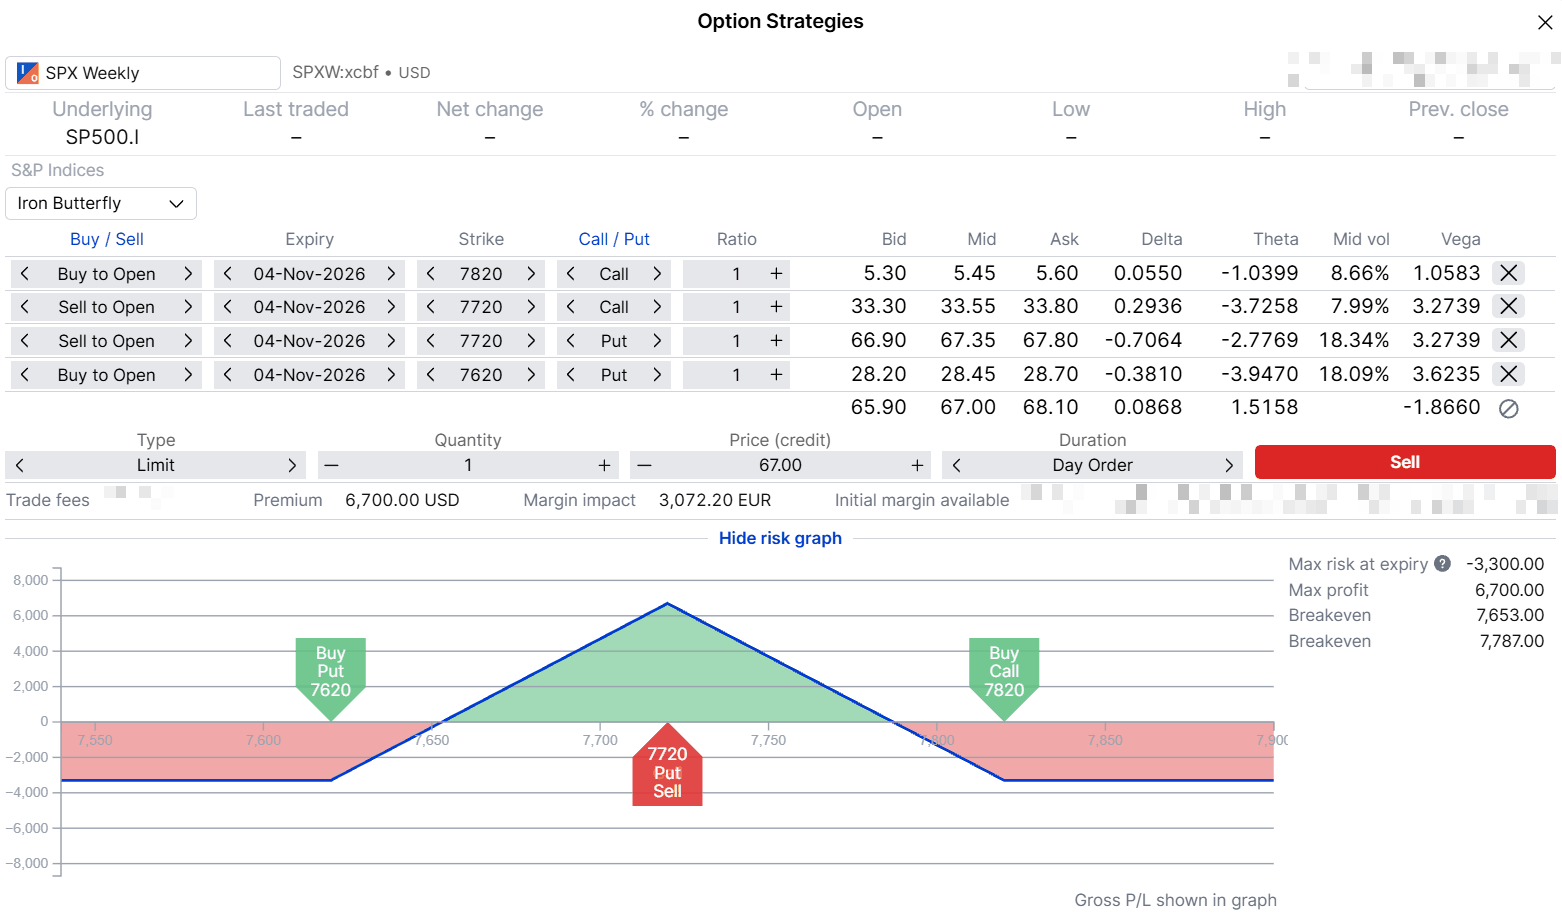 SPX iron butterfly with the 7,620 put, 7,720 put and call and 7,820 call, 4 November 2026 expiry, payoff at expiry. Hypothetical example for education only. Past performance is not indicative of future results; figures are illustrative and not predictive. Source: SaxoTrader, indicative quotes before the US open on 30 October 2026.
Applied to today’s index level, five of the nine past day-after moves would have stayed inside these break-evens; the other four, including 2018 and 2022, would not. Source: Saxo, Bloomberg price history, author calculation. Past performance is not indicative of future results. Options carry a high risk of rapid loss and are not suitable for every investor.
If the calm is wrong: a long straddle, and the cost of being early
The whole debit is lost if the index closes at 7,720 on 4 November. The buyer needs the move to beat what everyone else already pays for, and the drop in option prices after the results is likely to work against both legs from Wednesday’s open.
Example structure (illustrative only - not a trade recommendation)
- Buy 1 SPX 4 November 2026 7,720 call at about 33.55
- Buy 1 SPX 4 November 2026 7,720 put at about 67.35
- Net debit: about 100.90 points, 33.55 for the call plus 67.35 for the put, or USD 10,090 per contract
- Maximum loss: about USD 10,090 per contract (hypothetical, for education only), if the index closes at 7,720
- Maximum profit: not capped on the upside, and on the downside limited only by the index falling to zero (hypothetical, for education only). For example, a move of about 2.1% by Wednesday’s close, like the day after the 2018 and 2022 votes, would leave the straddle worth about 162 points, a gain of about USD 6,120 per contract before costs (hypothetical, for education only)
- Break-even at expiry: about 7,619 and 7,821, roughly 1.3% either side of the strike
- Costs and charges apply to each leg and vary by account and venue; check the applicable rates before entering any position.
- (Source: Saxo, indicative quotes before the US open on 30 October 2026)
What being early costs, at the 4 November close (hypothetical, for education only):
- Index moves 0.7% either way, the historical median, about 54 points: the straddle is worth about 54, a loss of about USD 4,690, a little under half the premium
- Index moves 3% either way, a bigger surprise than any midterm since 1990, about 232 points: the straddle is worth about 232, a gain of about USD 13,070 before costs
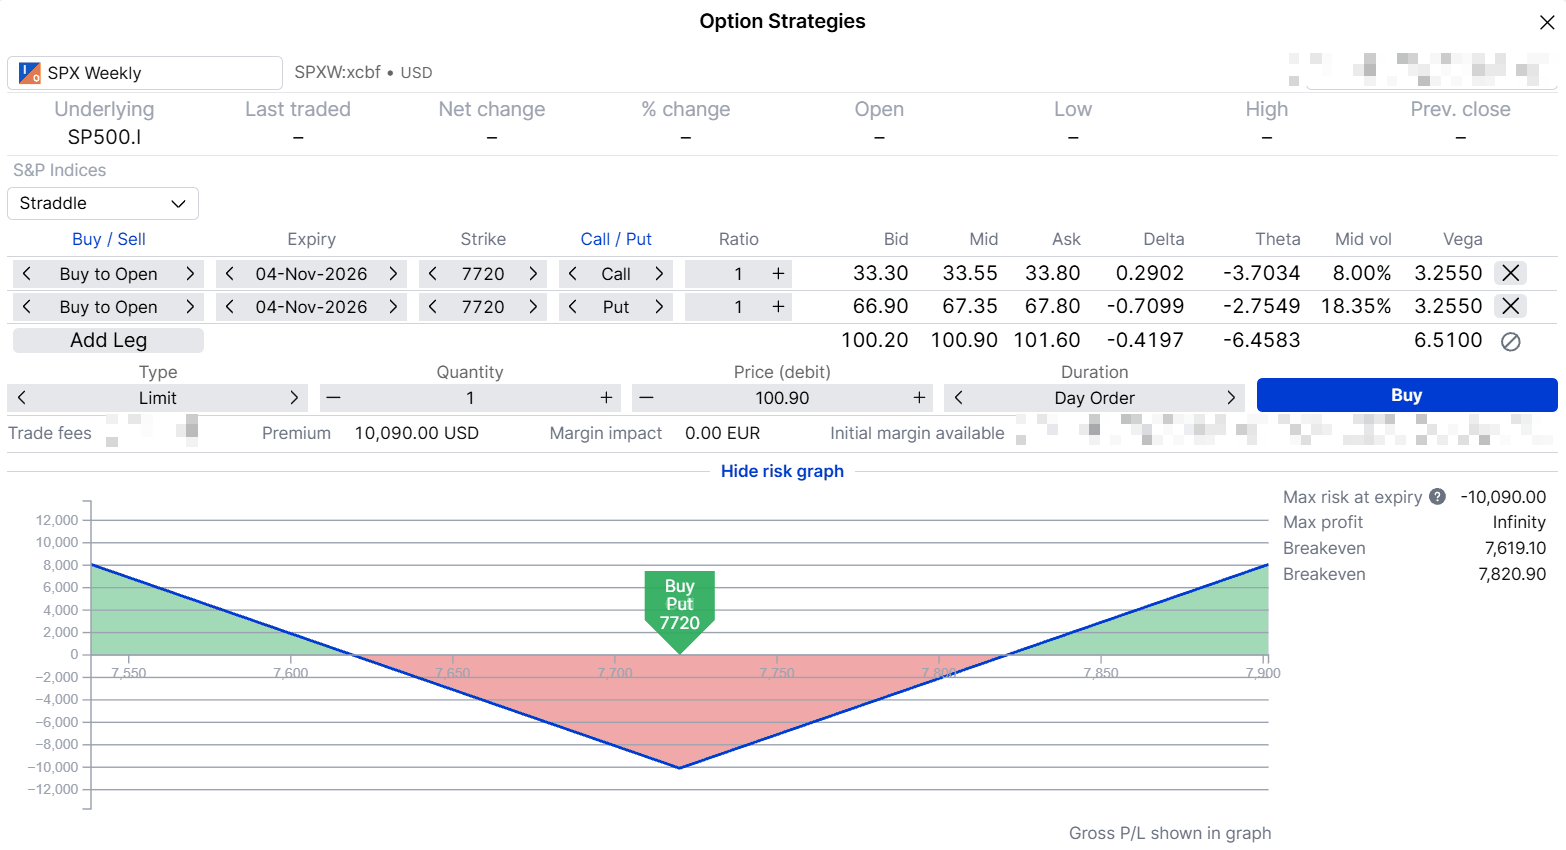 SPX long straddle with the 7,720 call and put, 4 November 2026 expiry, payoff at expiry. Hypothetical example for education only. Past performance is not indicative of future results; figures are illustrative and not predictive. Source: SaxoTrader, indicative quotes before the US open on 30 October 2026.
A quiet Wednesday, the outcome most of the market expects, leaves this structure with a loss. Options carry a high risk of rapid loss and are not suitable for every investor.
Taking profit before Wednesday’s close
Neither structure has to be held to expiry. Holding to the end means the view has to be right at one precise moment, and often it is not. A position can make or lose money along the way, and a common approach is to set a profit target in advance and close when it is reached:
- Iron butterfly: close once about a quarter of the maximum profit is in hand, roughly USD 1,675 per contract, by buying all four legs back for about 50.25 points; until then the maximum loss of about USD 3,300 still applies (hypothetical, for education only)
- Long straddle: close once the position is worth about 50% more than it cost, a gain of roughly USD 5,045 per contract, by selling both legs for about 151.35 points; until then the full USD 10,090 debit remains at risk (hypothetical, for education only)
A target is no guarantee. It may never be reached, prices can jump past it overnight, closing crosses the bid/ask spread again on every leg, and an early exit gives up the rest of the potential gain. The two structures also behave differently: the drop in option prices once results are known can bring the butterfly to its target quickly on a calm Wednesday, while the straddle needs its move to come early, before that drop eats into its value.
For holders: what protection through the vote costs
A put spread caps the cost of insurance by also capping the payout. The debit is lost if the index closes above the higher strike at expiry. In this example the long put sits about one priced move below the index and the short put 100 points lower; moving both closer to the index raises the cost and the chance of a payout.
Example structure (illustrative only - not a trade recommendation)
- Buy 1 SPX 6 November 2026 7,625 put at about 40.65
- Sell 1 SPX 6 November 2026 7,525 put at about 20.50
- Net debit: about 20.15 points, 40.65 for the long put less 20.50 for the short put, or USD 2,015 per contract
- Maximum loss: about USD 2,015 per contract (hypothetical, for education only), if the index closes above 7,625 on 6 November
- Maximum payout: about USD 7,985 per contract (hypothetical, for education only), if the index closes at or below 7,525 on 6 November
- Break-even at expiry: about 7,605, roughly 1.5% below Thursday’s close
- Costs and charges apply to each leg and vary by account and venue; check the applicable rates before entering any position.
- (Source: Saxo, indicative quotes before the US open on 30 October 2026)
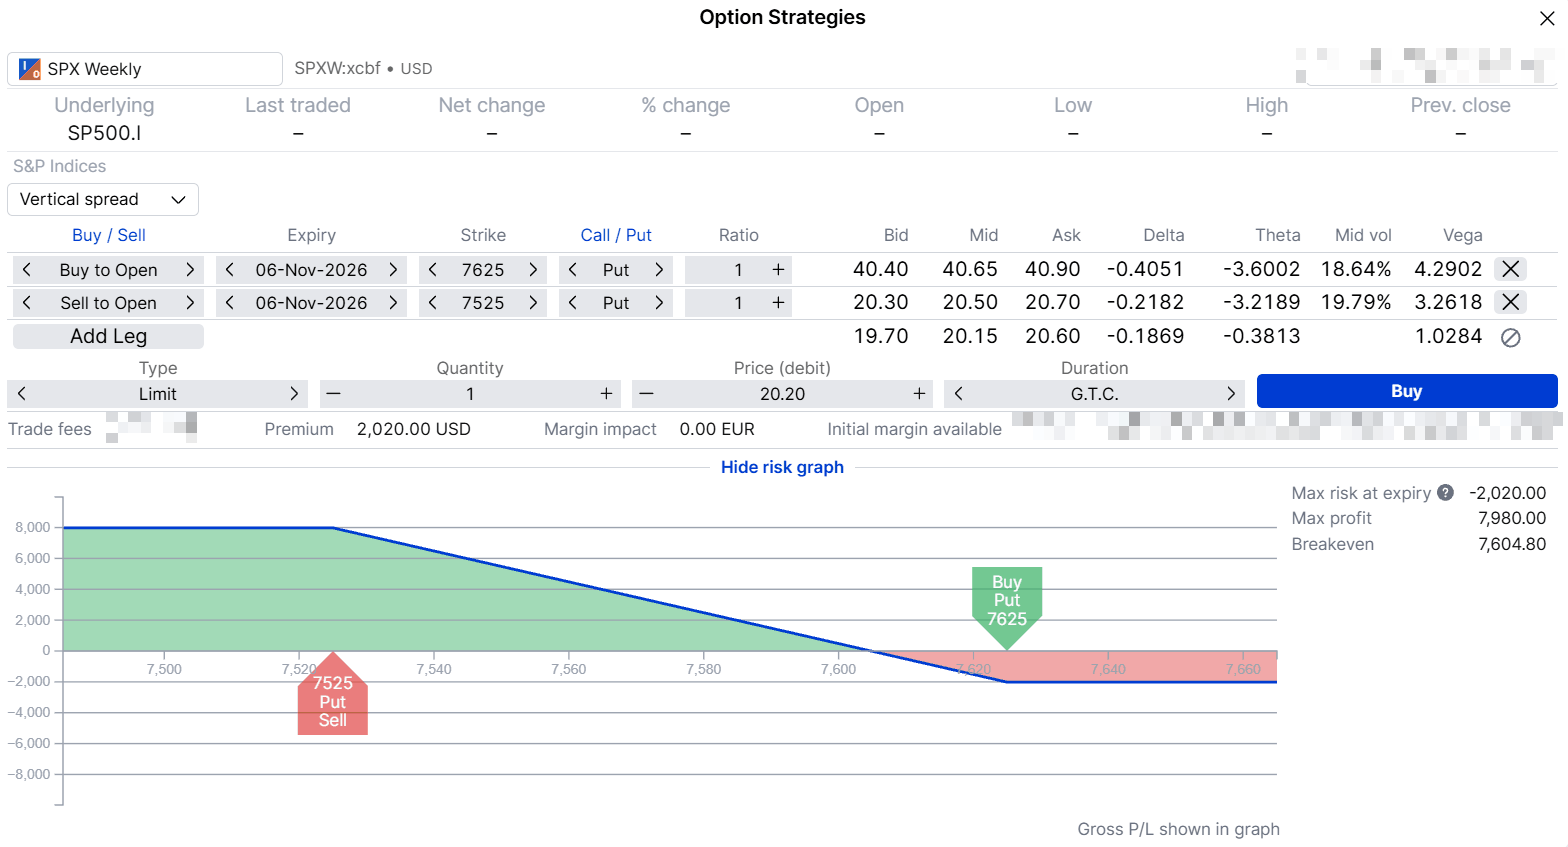 SPX put spread with the 7,625 and 7,525 puts, 6 November 2026 expiry, payoff at expiry. The screen uses a limit price of 20.20, just above the 20.15 mid, so its maximum loss, payout and break-even differ slightly from the figures in the text. Hypothetical example for education only. Past performance is not indicative of future results; figures are illustrative and not predictive. Source: SaxoTrader, indicative quotes before the US open on 30 October 2026.
The 6 November expiry also covers the jobs report, which suits a holder who wants cover for both events; the same strikes on 4 November cost a little less. Cheap protection can still expire worthless, and that is the usual outcome when nothing happens. Options carry a high risk of rapid loss and are not suitable for every investor.
Sectors: where analysts expect the differences
If the outcome shifts which sectors lead rather than the index, a call or put spread on a sector fund is one way to express a view on a single outcome with a loss limited to the premium paid. Utilities and power, healthcare and energy are the areas mentioned most in the scenarios above; other strategists also point to financials and defence. These structures are illustrative only - not trade recommendations: a call spread gains if a sector rises within a range and loses at most its debit; a put spread does the same for a fall. The maximum loss for either is the premium paid. Options carry a high risk of rapid loss and are not suitable for every investor. Costs and charges apply to each leg and vary by account and venue; check the applicable rates before entering any position.
Practical points before election week
- Contract size. One SPX option controls 100 times the index, so even a defined-risk structure carries a large amount per contract. XSP options on the Mini-SPX index, one tenth the size, are also listed and can be combined in one multi-leg order at Saxo, though their quotes were noticeably wider at the 29 October close.
- Settlement. SPX options are European-style and cash-settled: no early assignment and no shares delivered. A short leg still carries the full loss up to the wing at expiry.
- Wide quotes. In-the-money SPX options quoted several times wider than out-of-the-money ones at the 29 October close, which is why the examples stay at or out of the money.
- Timing. Results arrive overnight from Tuesday. The 4 November options expire at Wednesday’s close, so there is one session to react.
- The exit. Deciding the exit, including any profit target, before the results is easier than deciding during the move.
Final thoughts
In our view, the options market appears to be charging a modest premium for the midterms, close to the typical move of past elections but well below the last two. One example may gain if Wednesday is as quiet as priced, the other if it is not, and each has a maximum loss known before entry.
How much the election day adds to the straddle is something a reader can check on the chain right up to Tuesday. Whether any structure fits depends on the reader’s view, risk tolerance and live prices. Options carry a high risk of rapid loss and are not suitable for every investor.
The author does not hold positions in any of the instruments mentioned in this article. The Author is permitted to wait at least 24 hours from the time of the publication before they trade the instruments themselves.
| More from the author |
|---|