
You can access all of our platforms from a single Saxo account.

Amazon earnings: between a typical report and July's 15% jump

Summary: Five of Amazon's last eight reports moved the shares less than the options now price for 29 October 2026; the last one moved them twice as much. An iron condor and a long strangle show what each reading assumes.
Five of Amazon’s last eight reports moved the shares less than the options now price. The last one moved them twice as much.
Amazon’s last profit figure said little about its businesses. In the second quarter, most of its net income came from a gain of about USD 53 billion on investments, mainly its stake in Anthropic.
The third-quarter results are due on 29 October 2026, after the US close, so 30 October is the first session to price them. In our view, three other lines may matter more for the reaction:
- Growth at Amazon Web Services (AWS), the cloud business
- Operating income, guided to USD 22.5-26.5 billion for the quarter
- Spending: about USD 220 billion of investment planned for 2026, mostly in data centres, with free cash flow over the past twelve months now negative
(Source: Amazon second-quarter 2026 results and conference call, 30 July 2026.)
Options price a larger move than Amazon usually makes after a report, though a smaller one than the last. The two structures below read that gap from opposite sides.
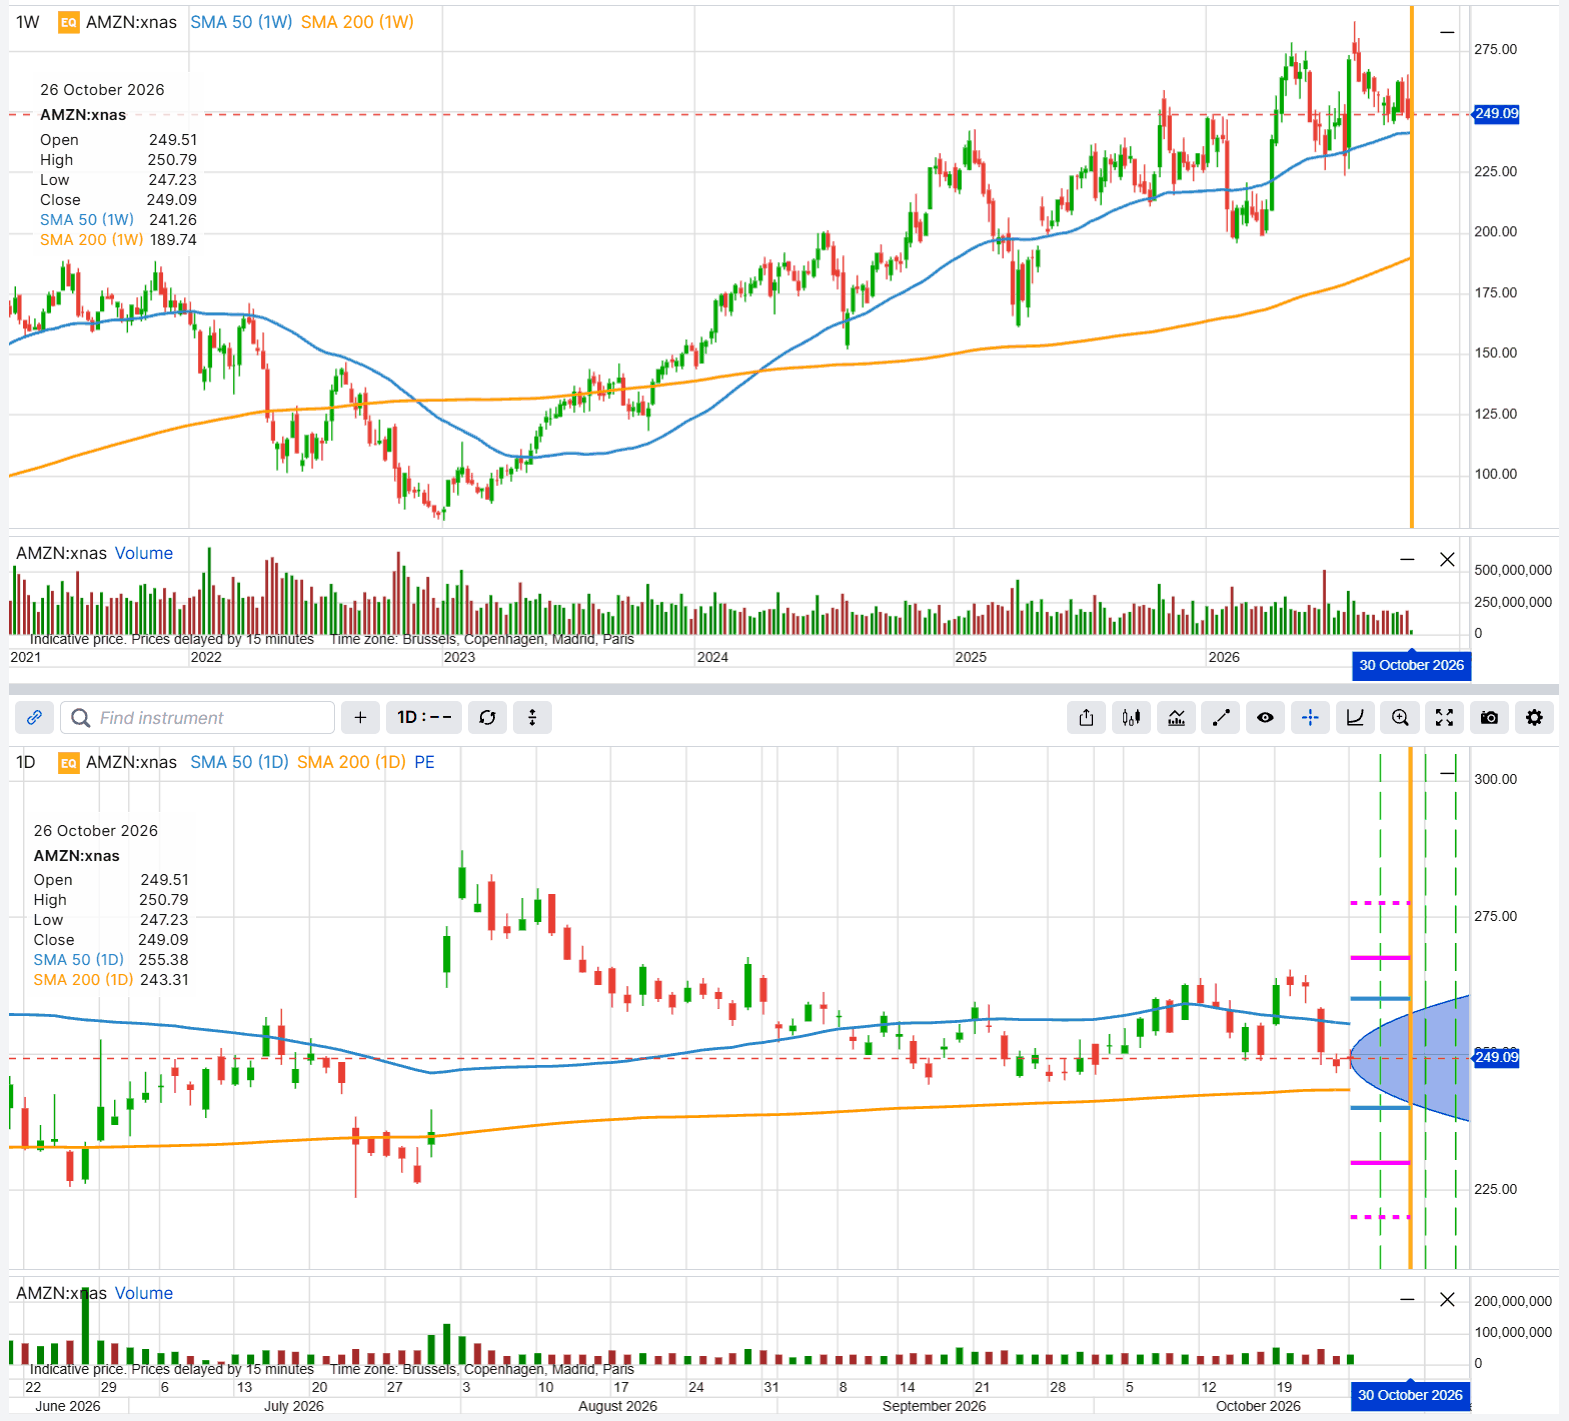 Amazon share price, weekly and daily, with the 30 October 2026 expiry, the strikes of the two examples and the range implied by option prices marked. Past performance is not indicative of future results; figures are illustrative and not predictive. Source: SaxoTrader, 26 October 2026 close.
Amazon’s report days since October 2024
Amazon has reported eight times since October 2024, always after the US close. Each move runs from the report-day close to the next close.
- Q3 2024 (31 October 2024): up 6.2%
- Q4 2024 (6 February 2025): down 4.1%
- Q1 2025 (1 May 2025): down 0.1%
- Q2 2025 (31 July 2025): down 8.3%
- Q3 2025 (30 October 2025): up 9.6%
- Q4 2025 (5 February 2026): down 5.6%
- Q1 2026 (29 April 2026): up 0.8%
- Q2 2026 (30 July 2026): up 15.3%
Four moves were up and four down. Ignoring direction, a typical move was about 6% (median and average alike). The most recent was the largest: a 15.3% jump in July 2026. Source: Saxo price data, author calculation. Past performance is not indicative of future results.
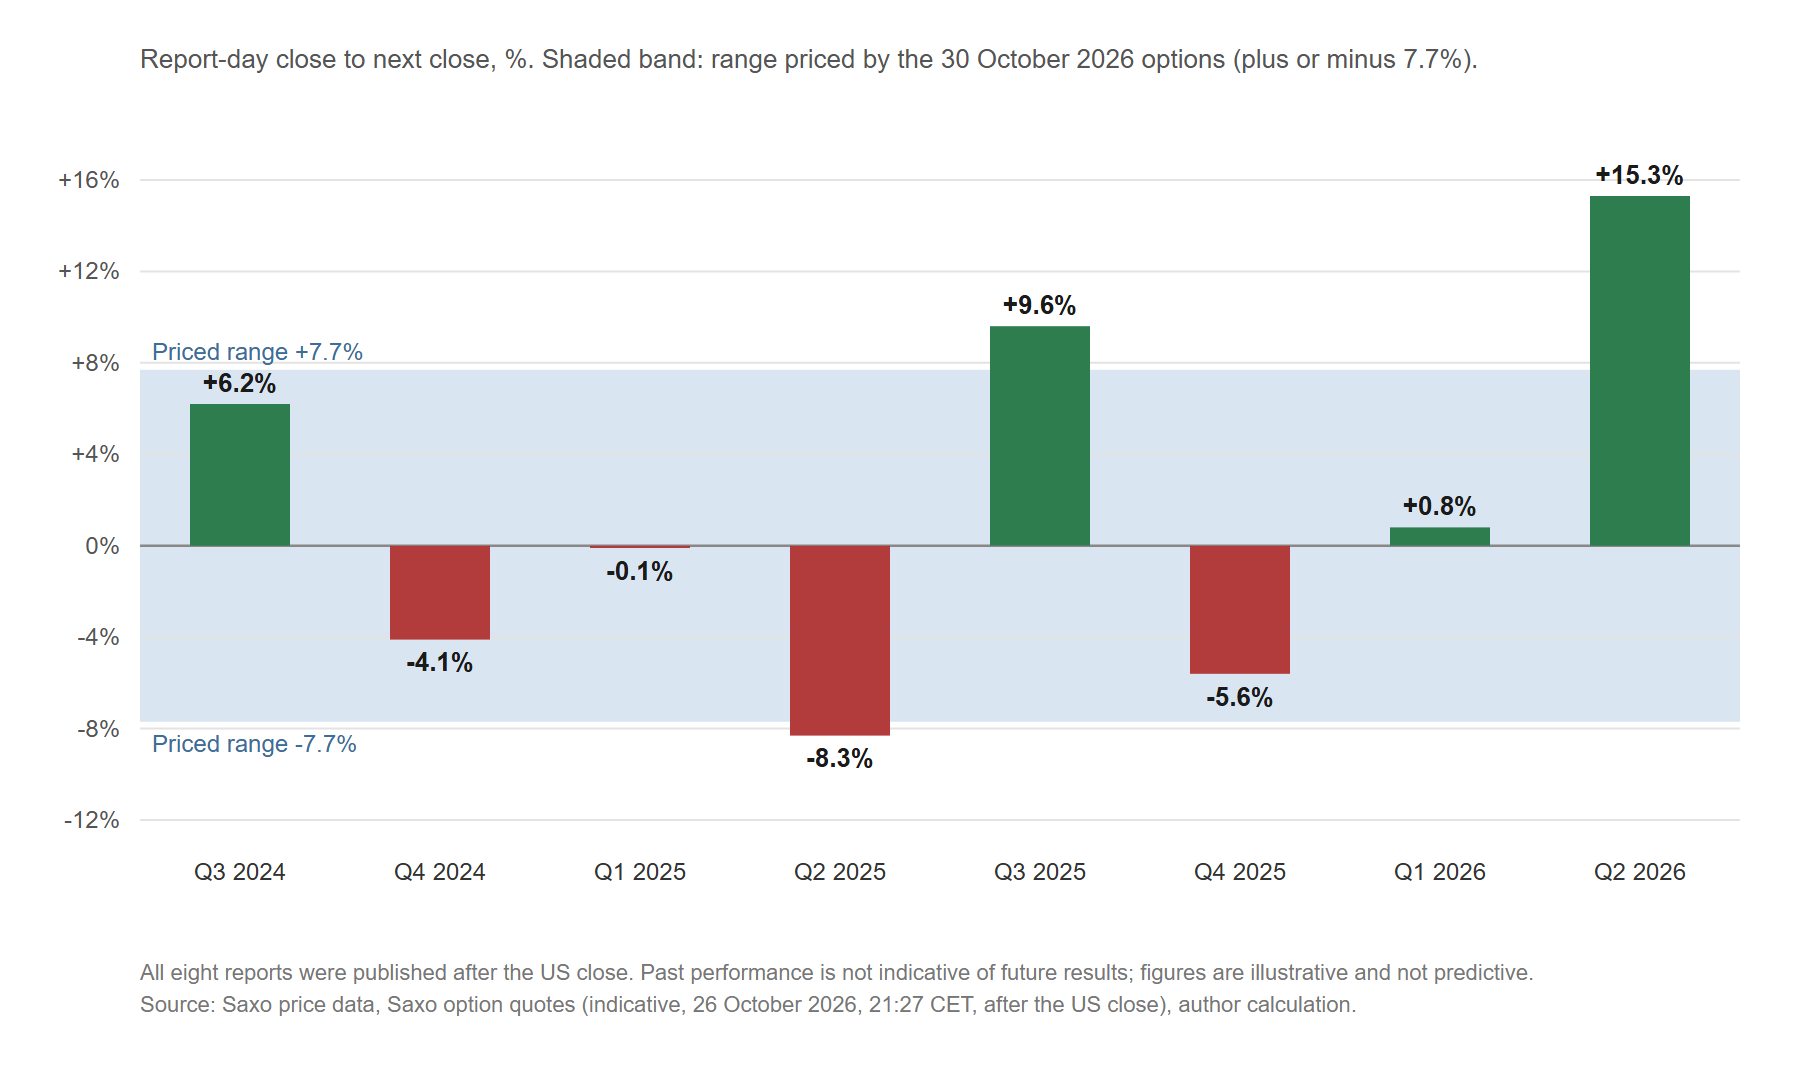 Amazon share price move from the report-day close to the next close on its last eight reports, against the range of about 7.7% priced by the 30 October 2026 options. Past performance is not indicative of future results; figures are illustrative and not predictive. Source: Saxo price data and indicative Saxo option quotes after the US close on 26 October 2026; author calculation.
The move priced into the 30 October expiry
The at-the-money call plus put on the first expiry after the report gives a rough guide to the expected move. For Amazon, the 250 strike is closest to the share price:
- Share price: about USD 249.09, the 26 October 2026 close
- 250 call, 30 October expiry: about USD 9.18
- 250 put, 30 October expiry: about USD 9.90
- Straddle: about USD 19.08, roughly 7.7% of the share price, or a range of about USD 230 to USD 268
- (Source: Saxo, indicative quotes after the US close on 26 October 2026)
That sits above the typical 6% and well below July’s 15%. Part of the price also pays for the ordinary days before the report. Much of it is uncertainty that usually drains out once the numbers are out, the IV crush, which helps option sellers and hurts buyers.
Important note: The strategies and examples provided in this article are purely for educational purposes. They are intended to assist in shaping your thought process and should not be replicated or implemented without careful consideration. Every investor or trader must conduct their own due diligence and take into account their unique financial situation, risk tolerance, and investment objectives before making any decisions. Remember, investing in the stock market carries risk, and it’s crucial to make informed decisions.
Where the strikes sit, and why 30 October
The 30 October weekly is the first expiry after the report; the 28 October expiry closes before it. Later expiries add ordinary trading days, which dilute the part of the price that belongs to the report.
Both structures take their strikes from the priced range of about USD 230 to USD 268, snapped to listed strikes:
- Iron condor: short strikes at about the edges of the range (230 and 267.50), long wings about half the priced move further out (220 and 277.50)
- Long strangle: long strikes about half the priced move from the share price (240 and 257.50)
Moving the condor’s short strikes closer raises the credit but narrows the zone that keeps it; moving the strangle’s strikes further out lowers the cost but needs a larger move. Contracts are 100 shares; all figures are hypothetical and for education only.
If the report is quieter than priced: an iron condor
The condor sells a put spread below the share price and a call spread above it. The risk comes first: a close beyond either long strike loses about twice the credit, a loss the wings cap. If Amazon closes between the short strikes on 30 October, it keeps the credit, and IV crush helps from the first session after the report.
Example structure (illustrative only - not a trade recommendation)
- Sell 1 Amazon 30 October 2026 230 put at about USD 2.61 (bid 2.58, ask 2.64)
- Buy 1 Amazon 30 October 2026 220 put at about USD 1.10 (bid 1.08, ask 1.12)
- Sell 1 Amazon 30 October 2026 267.50 call at about USD 3.20 (bid 3.10, ask 3.30)
- Buy 1 Amazon 30 October 2026 277.50 call at about USD 1.51 (bid 1.46, ask 1.56)
- Net credit: about USD 3.20 per share, USD 1.51 from the puts (2.61 less 1.10) plus USD 1.69 from the calls (3.20 less 1.51), or USD 320 per contract
- Maximum loss: about USD 680 per contract (hypothetical, for education only), the USD 10 between the strikes on one side less the 3.20 credit, if Amazon closes below 220 or above 277.50; maximum profit: about USD 320 (hypothetical, for education only), if it closes between 230 and 267.50
- Break-even at expiry: USD 226.80 and USD 270.70, about 8.9% below and 8.7% above the share price
- Costs and charges apply to each leg and vary by account and venue; check the applicable rates before entering any position.
- (Source: Saxo, indicative quotes after the US close on 26 October 2026)
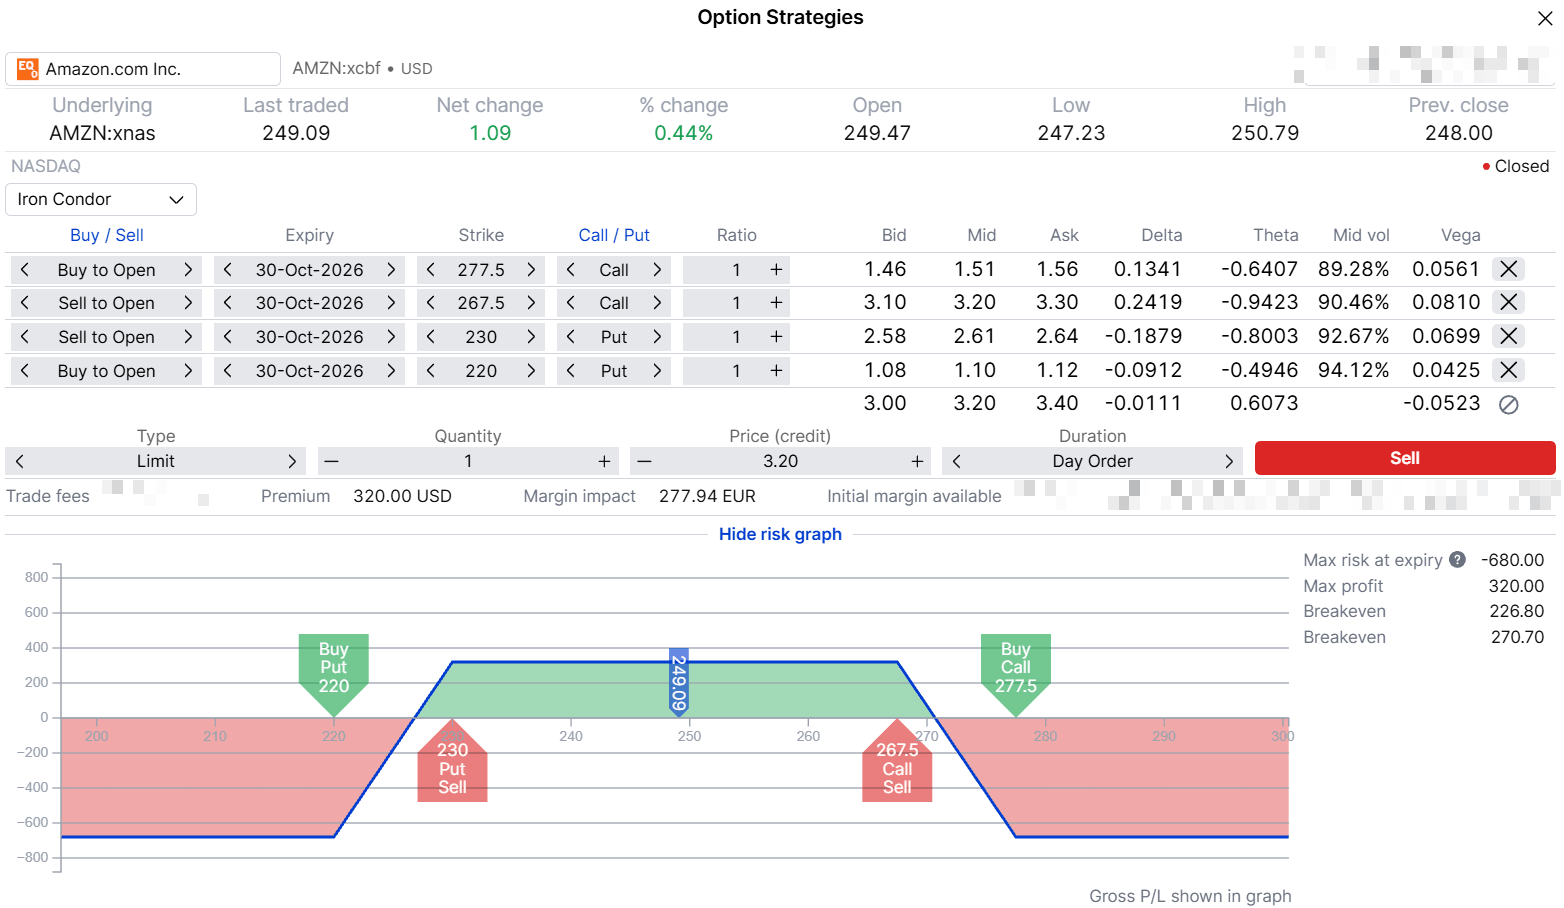 Iron condor with 220/230 puts and 267.50/277.50 calls, 30 October 2026 expiry, payoff at expiry. Hypothetical example for education only. Past performance is not indicative of future results; figures are illustrative and not predictive. Source: SaxoTrader, indicative prices after the US close, 26 October 2026.
Its best case is a report like most of the eight; its worst, one like July 2026. Options carry a high risk of rapid loss and are not suitable for every investor.
If the report rivals July: a long strangle
The strangle buys a call above the share price and a put below it. The risk comes first: the debit is the most that can be lost, and all of it goes if Amazon closes between the strikes on 30 October. IV crush works against both options after the report, so the move has to outrun it. If it does, the call side’s gain has no cap.
Example structure (illustrative only - not a trade recommendation)
- Buy 1 Amazon 30 October 2026 257.50 call at about USD 6.05 (bid 5.95, ask 6.15)
- Buy 1 Amazon 30 October 2026 240 put at about USD 5.43 (bid 5.35, ask 5.50)
- Net debit: about USD 11.48 per share, USD 6.05 for the call plus USD 5.43 for the put, or USD 1,148 per contract
- Maximum loss: about USD 1,148 per contract (hypothetical, for education only), the full debit, if Amazon closes between 240 and 257.50; maximum profit: not capped on the upside (hypothetical, for education only)
- Break-even at expiry: USD 268.98 and USD 228.52, about 8.0% above and 8.3% below the share price
- Costs and charges apply to each leg and vary by account and venue; check the applicable rates before entering any position.
- (Source: Saxo, indicative quotes after the US close on 26 October 2026)
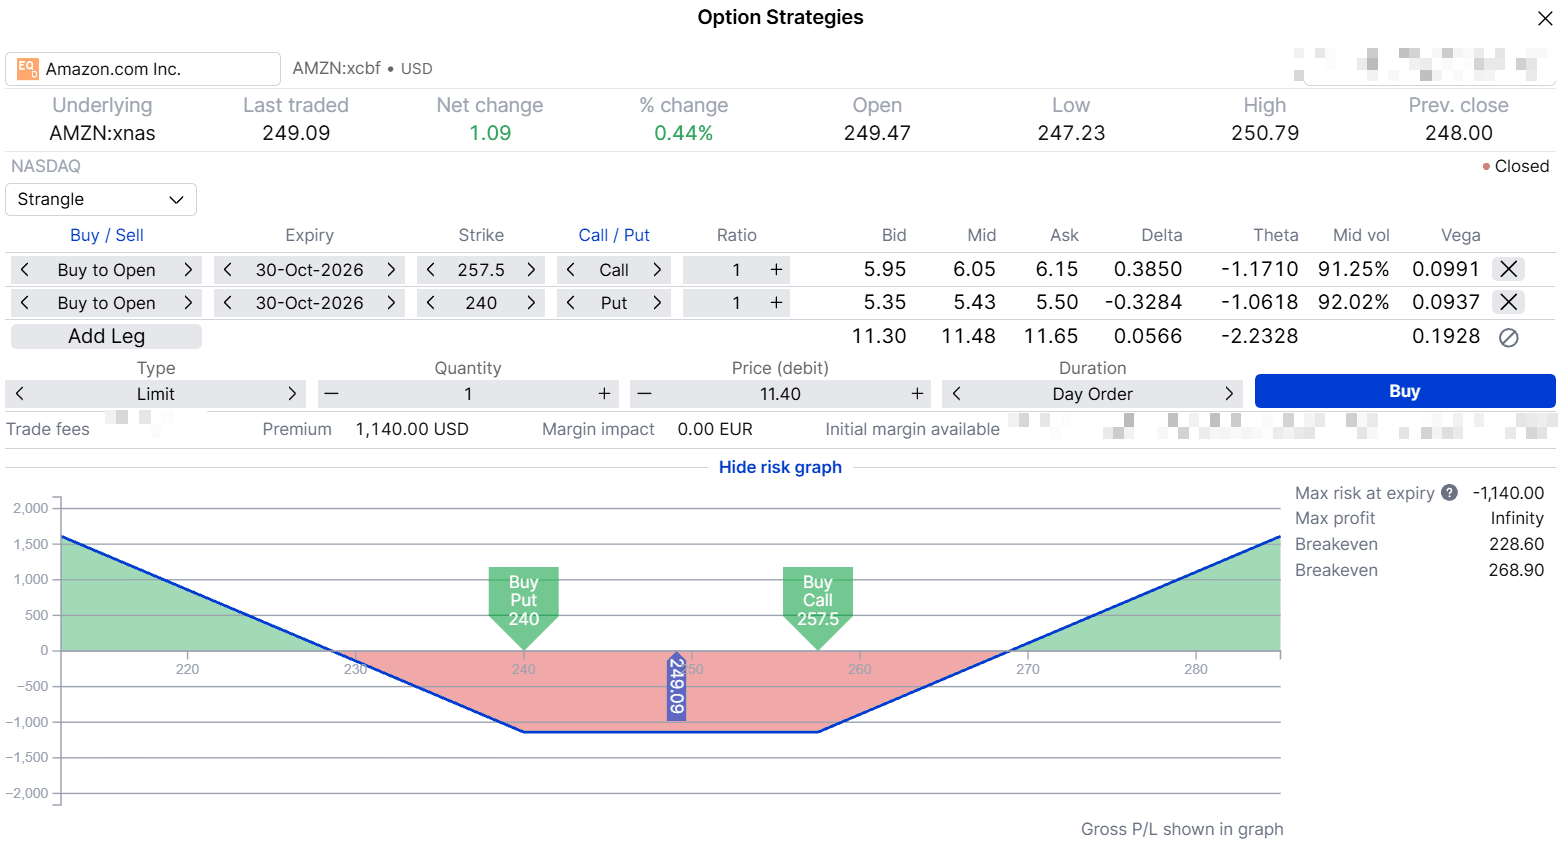 Long strangle with the 240 put and the 257.50 call, 30 October 2026 expiry, payoff at expiry. The screen uses a limit price of USD 11.40, slightly below the USD 11.48 mid, so its maximum loss and break-evens differ slightly from the figures above. Hypothetical example for education only. Past performance is not indicative of future results; figures are illustrative and not predictive. Source: SaxoTrader, indicative prices after the US close, 26 October 2026.
A move of about 8% either way only gets back to break-even, and a report like most of the eight leaves a loss. Options carry a high risk of rapid loss and are not suitable for every investor.
Both structures against the last eight reports
Applied to the 26 October close, six of the eight report moves would have ended inside the condor’s break-evens, and three beyond the strangle’s. The fall after the July 2025 report lands near the edge for both: the condor would have kept about half its credit, and the strangle would have roughly broken even. Source: Saxo price data, author calculation.
Eight reports are a small sample, and past performance is not indicative of future results. The test only shows what each structure assumes: the condor loses most on a report like July 2026, the strangle on most of the others.
Costs, timing and the exit
- Costs add up with every leg. Each leg is charged separately and crosses its own bid/ask spread. Both examples can be placed as a single multi-leg order on Saxo.
- Timing. The first reaction lands at the open on 30 October 2026, the expiry day itself, so both structures have one session left.
- A crowded calendar. The US Federal Reserve decides on rates on 28 October 2026, and Microsoft reports after the close that day. Either can move Amazon before its own report. (Source: Federal Reserve; Microsoft investor relations.)
- The exit. Closing on 30 October or letting the options expire is easier to decide before the report than during the move.
Assignment risk: Amazon options are American-style, so a short leg that moves into the money can be assigned before expiry, particularly close to expiration. Only the condor has short legs.
Final thoughts
Amazon’s report history can be read as a share that usually moves about 6%, or one that has just jumped 15%; the options price something in between. In our view, weighing those two readings may be more useful than guessing the direction, which split evenly over the last eight reports.
Both examples have a maximum loss known before entry, and each loses on the outcome the other is built for. Which, if either, fits depends on the reader’s view, risk tolerance and live prices. Options carry a high risk of rapid loss and are not suitable for every investor.
The author does not hold positions in any of the instruments mentioned in this article. The Author is permitted to wait at least 24 hours from the time of the publication before they trade the instruments themselves.
| Related articles/content |
|---|
| Microsoft earnings is the options market leaning up or down | 26 Oct 2026 Visa earnings options price a bigger move than Visa usually makes | 22 Oct 2026 Meta earnings options price a smaller move than Meta usually makes | 20 Oct 2026 Tesla earnings the median says small the average says big What do options price | 19 Oct 2026 ASML earnings three ways to read the move options are pricing | 12 Oct 2026 Same coin different payoffs an options toolkit for earnings season | 7 Oct 2026 Earnings season is close to a coin flip The edge is in what happens next | 5 Oct 2026 Finding unusually expensive or cheap options in the Saxo screener | 18 Sep 2026 Implied volatility rank what it measures and what it misses | 11 Sep 2026 Nine prints later what Q2 earnings season taught us | 11 Aug 2026 What IV crush really means in practice reviewed version | 9 April 2026 Trading earnings with defined | 31 Mar 2026 |
| More from the author |
|---|