
You can access all of our platforms from a single Saxo account.

Same coin, different payoffs: an options toolkit for earnings season

Summary: Earnings direction is close to a coin flip, so the useful decision is the payoff shape. Eight structures, matched to five reads on the move the options market is pricing in.
A single earnings trade is close to a coin flip on direction. The question worth answering instead is which payoff shape fits the read on the priced-in move.
Direction after a report is close to even odds, as a companion piece published this week, "Earnings season is close to a coin flip," explored. What separates a profitable season of trades from a losing one is rarely the direction called. A trader who is right most of the time can still lose money if the wins are small and the losses are not; a trader who is wrong more often than right can finish ahead if the payoff asymmetry runs the other way. Win rate alone decides little; win rate combined with payoff size decides the result. My colleague Charu Chanana’s Q3 earnings preview adds useful context: earnings estimates were raised rather than cut into this quarter, so a plain beat may not be enough to move the stock (Q3 earnings preview: when a beat is no longer enough).
If direction is close to even odds, the useful decision is which payoff shape fits, and that starts with a read on the size of the priced-in move.
Start from the price of the move
Before choosing a structure, two numbers help: the move the options market is pricing in, and the moves the stock has produced after past reports.
The first number, the expected move, comes from the at-the-money straddle for the expiry that covers the report: add the price of the at-the-money call and put, and that combined premium, as a percentage of the stock price, is what the market is pricing. A stock trading at $100 with a $6 straddle has an expected move of about 6% (hypothetical, for illustration only).
The second number comes from the stock’s own history: how far it moved, as a percentage of price, after each of its last several reports. A typical figure, an average or median across those reports, is more useful than any single reaction, since one unusually large or small move can distort a plain average. Past performance is not indicative of future results.
Comparing the two percentages is what produces a read. When the priced move sits well above the stock’s typical move, the options market looks rich: more premium is being charged than the stock has required. When the priced move sits well below that typical move, it looks cheap. When the two percentages land close together, the move looks about fair, and any directional opinion has to come from somewhere other than this comparison, since the expected-move calculation says nothing about direction, only size. A separate comparison matters too: the implied volatility, or equivalently the straddle cost, of the expiry covering the report against a later expiry that covers no such event. When the event expiry is priced rich relative to that later one, the extra premium is concentrated in the report itself, which is the setup a calendar spread is built to use.
The toolkit
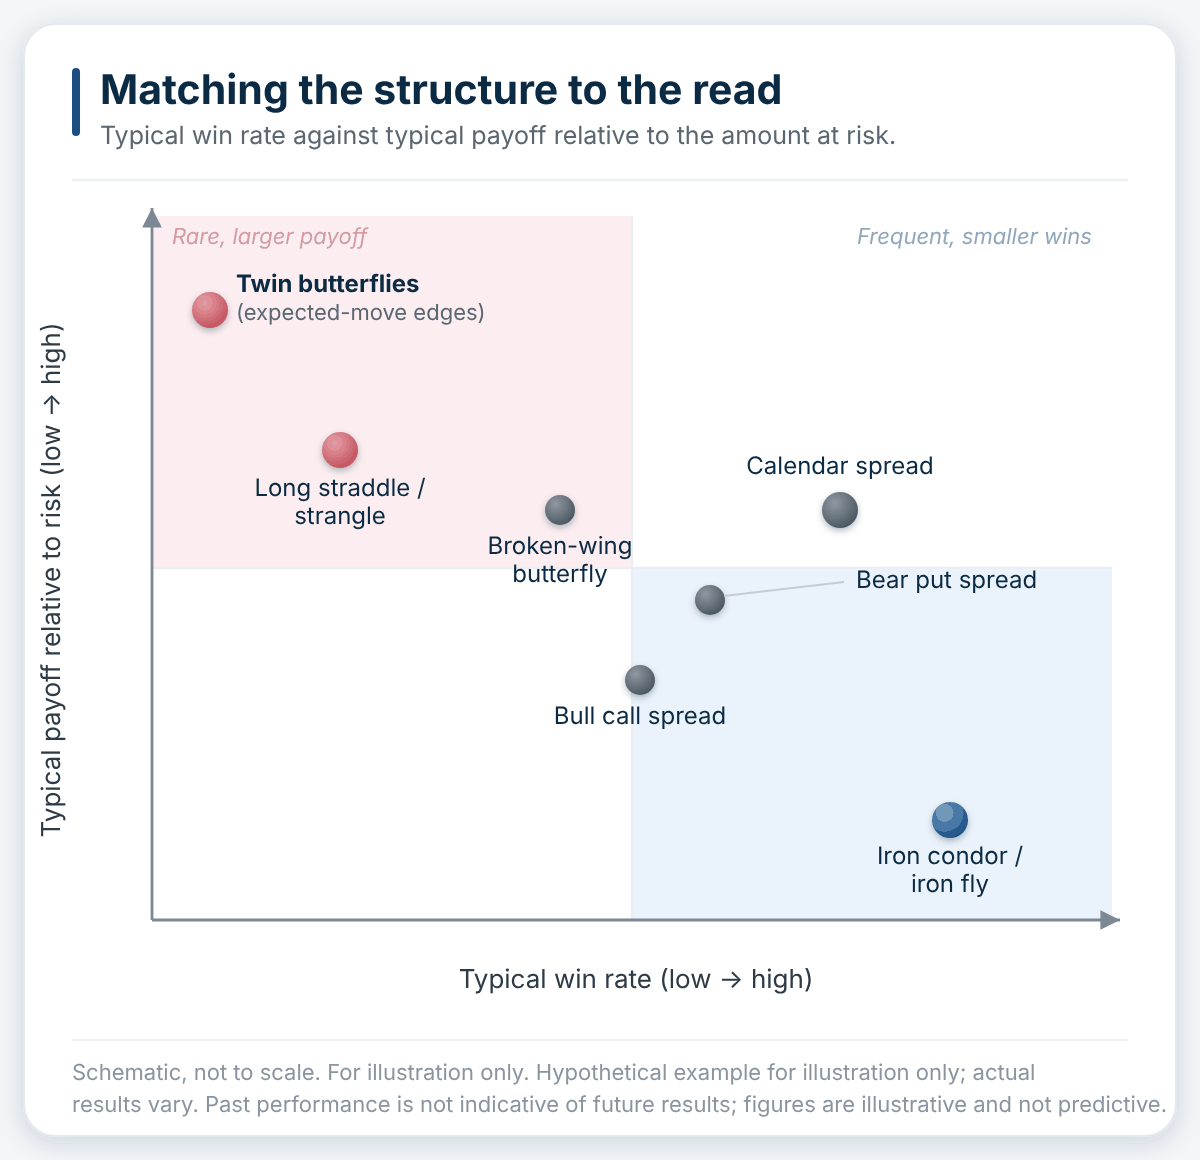 Schematic map of typical win rate against typical payoff relative to the amount at risk, for seven of the structures below. Schematic, not to scale. For illustration only. Hypothetical example for illustration only; actual results vary. Past performance is not indicative of future results; figures are illustrative and not predictive. Source: author illustration.
The structures below are illustrative only, not trade recommendations, and every description is hypothetical and for educational use only. Options carry a high risk of rapid loss and are not suitable for every investor.
The move looks rich (illustrative only, not a trade recommendation)
Iron condor / iron fly. Sells the richly priced event premium with both tails capped, and a falling implied volatility after the report tends to help the position; the trade-off is a defined maximum loss, reached once the stock closes beyond a wing at expiry. Frequent small gains, an occasional larger loss up to that cap. Costs: Saxo pricing.
The move looks cheap (illustrative only, not a trade recommendation)
Long straddle / strangle. Pays off on a large move in either direction, but the stock must travel past the priced-in move to break even, and the same volatility drop that helps the iron condor works against this position; maximum loss is the full premium paid. Costs: Saxo pricing.
Twin butterflies at the edges of the expected move. The same thesis as the straddle, built cheaper: one butterfly near the upper edge of the expected move using calls, one near the lower edge using puts. The combined debit typically runs a fraction of the straddle’s cost, so the post-report volatility drop does less damage in absolute terms; the trade-off is that it only pays well if the stock finishes near one of the two centres, and a move that stalls in the middle or overshoots beyond either edge gives back most or all of the debit, with maximum loss equal to that debit. Full payoff arrives close to expiry, so the expiry right after the report keeps the position tight; closed earlier, it is worth less. The structure wins only some of the time but can pay several times its cost, an asymmetry that can offset a lower win rate (hypothetical, for education only). Costs: Saxo pricing.
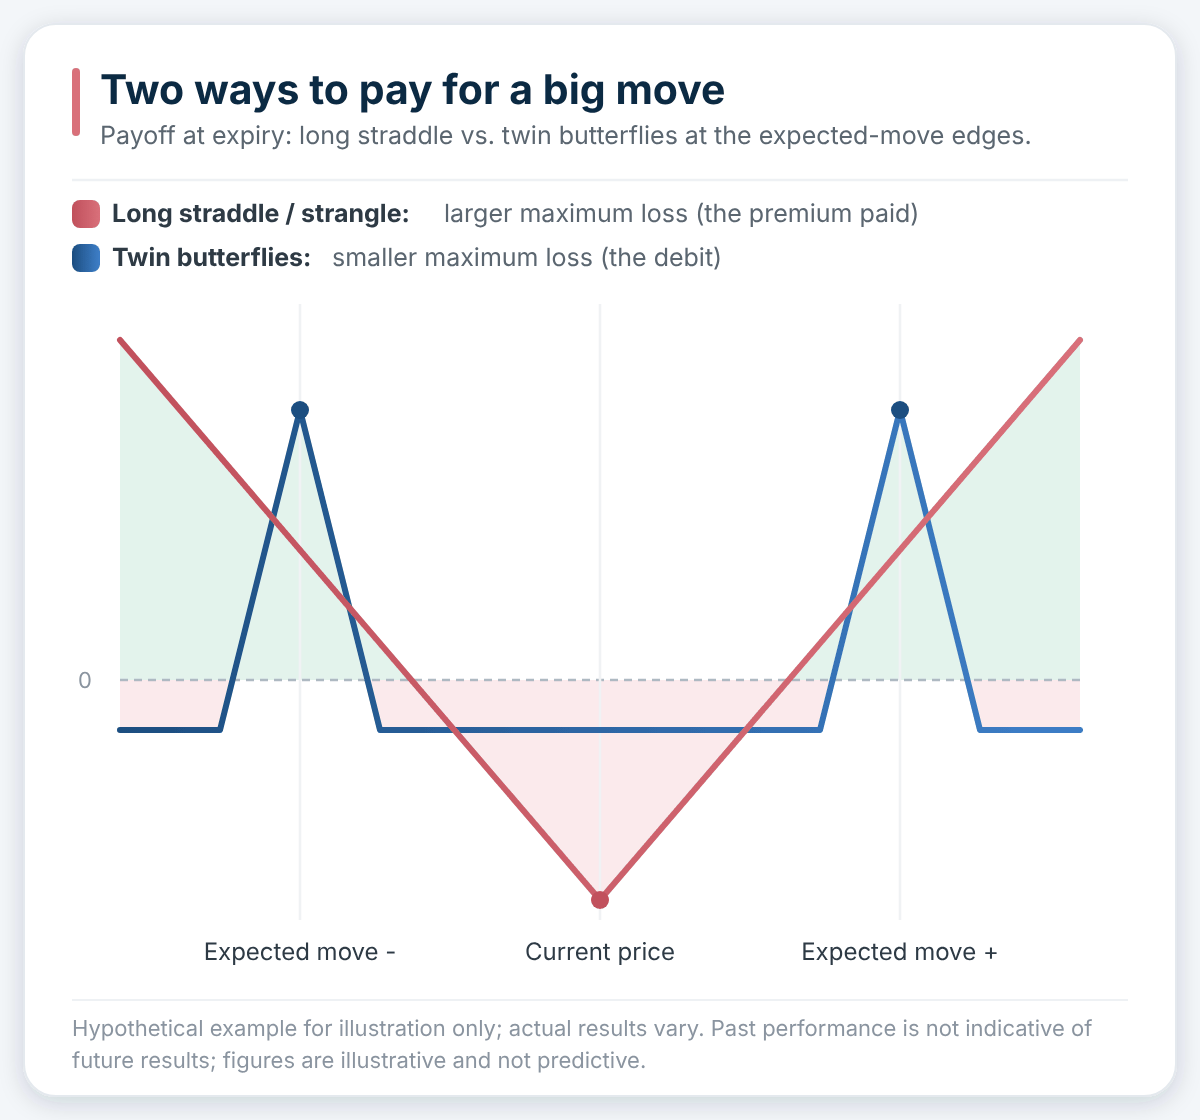 Schematic payoff at expiry, a long straddle compared with two butterflies centred at the edges of the expected move. Hypothetical example for illustration only; actual results vary. Past performance is not indicative of future results; figures are illustrative and not predictive. Source: author illustration.
About fair, with a directional lean (illustrative only, not a trade recommendation)
Bull call / bear put spread. Directional with defined risk: the long and short legs largely offset each other’s sensitivity to the post-report volatility drop, so that decline hurts less than it would a single long option; maximum loss is the net debit paid. Costs: Saxo pricing.
Broken-wing butterfly. A butterfly with one wing set further out, often opened for a small credit or close to zero, so there is no loss if the stock moves against the lean on the safe side; the best result sits at the body, and the maximum loss, though capped, begins beyond the far wing. Costs: Saxo pricing.
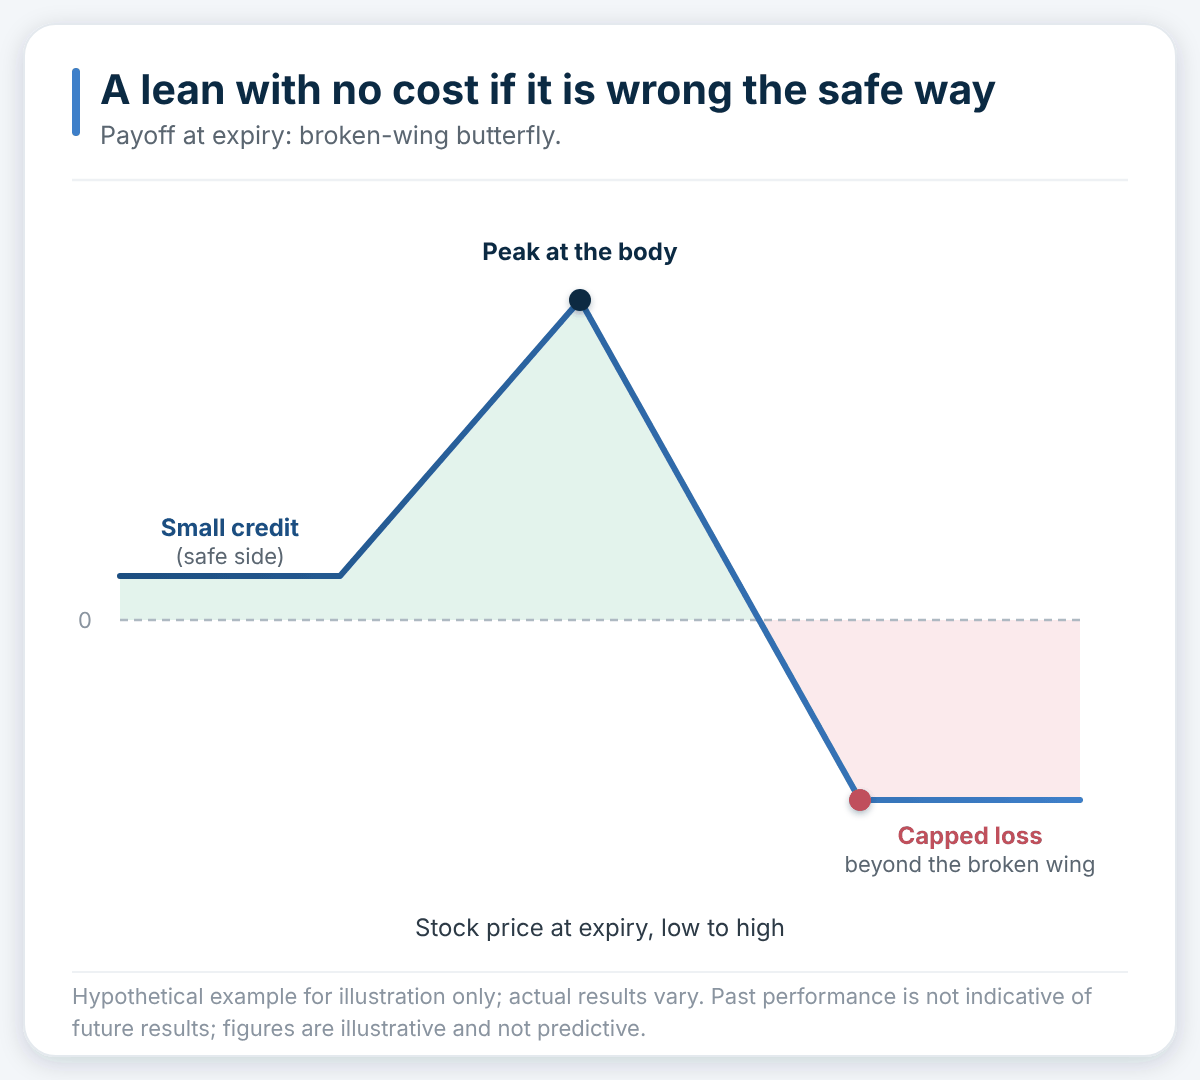 Schematic payoff at expiry for a broken-wing butterfly. Hypothetical example for illustration only; actual results vary. Past performance is not indicative of future results; figures are illustrative and not predictive. Source: author illustration.
The event is priced rich against later expiries (illustrative only, not a trade recommendation)
Calendar spread. Sells the expiry containing the report and buys a later expiry at the same strike, benefiting when the front-month volatility collapses after the report while the later expiry holds up, provided the stock stays near the strike; a large move away from the strike is the risk, and the maximum loss is the net debit paid, and the profit and break-even picture is model-dependent rather than fixed at entry. Costs: Saxo pricing.
Already holding, or willing to own
Covered calls, cash-secured puts and collars fit a reader already holding the stock or willing to own it; they sit outside this toolkit.
Nothing stands out
Sometimes none of the comparisons above gives a clear read. Skipping is a structure too: it carries no position and no cost, and keeps the decision open for a report where one of the comparisons actually stands out.
The exit belongs to the structure
- Short-premium structures (iron condor, iron fly): close after the report rather than carrying the position to expiry, since most of the benefit from falling volatility shows up early.
- Long straddle / strangle: implied volatility falls at the open, so the exit is better decided before the print than improvised afterward.
- Butterflies, twin or broken-wing: the profit zone is narrow, and taking part of a gain can be preferable to holding for the full expiry payoff.
- Calendar spreads: close both legs together, since the position’s value depends on the relationship between the two expiries rather than either leg alone.
Final thoughts
The structure follows the read on the priced-in move, not the other way round, and the same handful of comparisons recurs every reporting season regardless of which names are on the calendar. Options carry a high risk of rapid loss and are not suitable for every investor, and every description above is hypothetical and for educational use only, not a recommendation to use any structure on any name.
Important note: The strategies and examples provided in this article are purely for educational purposes. They are intended to assist in shaping your thought process and should not be replicated or implemented without careful consideration. Every investor or trader must conduct their own due diligence and take into account their unique financial situation, risk tolerance, and investment objectives before making any decisions. Remember, investing in the stock market carries risk, and it’s crucial to make informed decisions.
| More from the author |
|---|