
You can access all of our platforms from a single Saxo account.

Seoul broke, the index did not - Options Brief - 13 October 2026

Summary: Korean chip stocks fell through a six per cent decline overnight and the index that owns the same companies closed unchanged. The semiconductor complex walked into it carrying the cheapest options it has carried in a year.
Korean chip stocks fell six percent overnight. The index owning them closed unchanged.
MARKET REGIME: LOW VOL BULL | VIX 15.21 | TERM STRUCTURE: CONTANGO | SKEW: ELEVATED (155.06) | FRONT-MONTH VIX FUTURES: 16.95
Key findings
- Korea fell through 6,000, the index did not move. The Kospi lost 6.12%; Monday’s close of 7,807.24 was down 0.06%, using 5% of this week’s priced range.
- The front of the curve split. VIX1D fell 14.70% to 7.72 on an empty day; VIX9D rose 3.73% to 11.68 across inflation data and earnings.
- Semiconductor options walked in near their floor. None of the fourteen names sits above the midpoint of its one-year range; the four closest to the story sit in the bottom tenth.
- The widest earnings premium is Bank of America’s, 3.5% against a typical 2.2%.
Headline driver
Two things landed on the memory complex at once: reported progress by the Chinese manufacturer CXMT on a denser competing memory design, cited as the driver, and remarks from Broadcom’s chief executive comparing the artificial-intelligence spending race to a casino. The Kospi fell 6.12%, broke below 6,000 and triggered Korea’s first sell-side trading curb in nearly two months, with foreign selling concentrated in the Korean memory names.
The US session before it gave ground in the same place only. The Philadelphia semiconductor index fell 2.7%, Micron about 4% and the memory-focused index 4.32%, while the broad index finished unchanged because money moved into other large caps rather than out of equities.
In our view this may be a sector repricing rather than a market one, at least so far. Options carry a high risk of rapid loss and are not suitable for every investor.
Market snapshot
Levels are as of the 06:00 CET snapshot on 13 October 2026. US and European figures are the Monday 12 October close; Asian figures are Tuesday’s session in progress.
- US (Monday 12 October close): S&P 500 7,807.24, down 0.06%. Nasdaq 100 30,664.70, down 0.71%. Dow 51,856.18, up 0.38%. The equal-weighted S&P rose 0.07%, so the weakness sat in the largest technology weights. Meta gained 3.38%, Apple 1.29% and Microsoft 1.14%, against Nvidia down 1.29% and the semiconductor fund down 2.05%.
- Europe (Monday 12 October close): DAX up 0.76%, Euro Stoxx 50 up 0.45%, Stoxx Europe 600 up 0.65%, euro-area banks up 1.21%. Europe closed before the Asian selling began.
- Asia (Tuesday session, in progress): Kospi 5,993.62, down 6.12%, through 6,000 and into a sell-side trading curb. The Nikkei fell 2.22% on its return from a three-day weekend, Hang Seng Tech 1.54% and the CSI 300 0.57%. The Korea fund listed in New York had already fallen 4.02% on Monday.
- Commodities and rates: Energy led US sectors on Monday, up 1.43%, while gold eased 0.63%. The US cash Treasury market was shut for Columbus Day, so quoted yields span the holiday: the 10-year is 5.192% and the 2-year 4.768%, against 5.242% and 4.791% at Friday’s close.
- Market regime: Low Vol Bull. VIX 15.21, 20-day realised volatility 9.46% and stable, the index 1.35% above its 50-day average.
Past performance is not indicative of future results. Source: Saxo, Bloomberg, CBOE.
Volatility surface
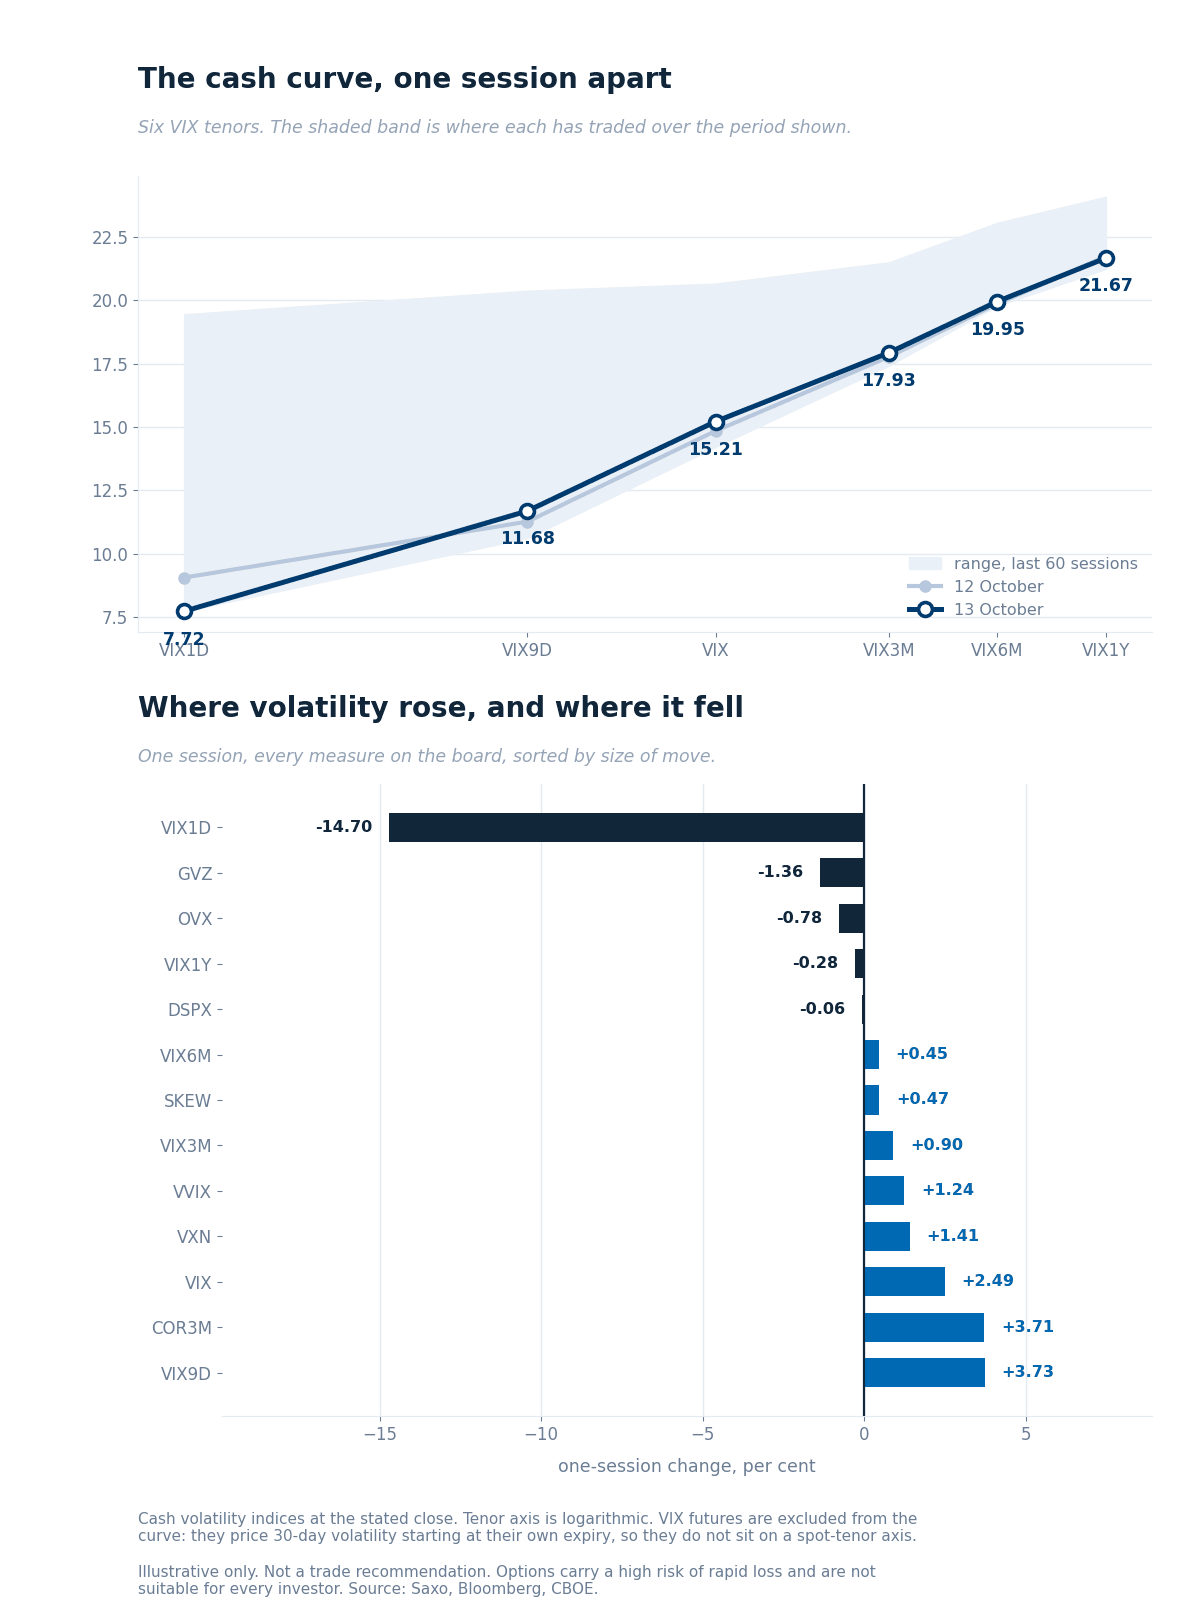
The cash curve against the previous session, over the range each tenor has traded in the last 60 sessions, with the one-session change across every measure on the board. MOVE is excluded from the change panel: the US cash Treasury market was closed on Monday, so its reading repeats Friday’s and carries no session change. Source: Saxo, Bloomberg, CBOE.
The curve’s shape carries the argument. VIX1D at 7.72 sits at the bottom edge of its 60-session band while every tenor from three months out sits inside its own, so premium came out of today rather than out of volatility generally. The calendar explains it: today holds Fed speakers and second-tier data, and the inflation print lands tomorrow.
Ratios. VIX3M/VIX at 1.18 keeps the curve in contango, a touch flatter than 1.20. VXN/VIX at 1.37 is below the 1.38 of a session earlier, so the Nasdaq’s volatility premium has not widened despite the chip selling.
VIX futures. The nearest listed VIX option expiry, 21 October, gives a parity forward of 16.77, consistent to 0.02 across the five strikes nearest the money. The second contract prices 17.63, so the curve stays in contango. The front premium to spot is 1.56 points against 2.28 on the same expiry a session earlier: spot rose while the future fell. The feed’s own change column for the front contract does not reconcile against the stored prior level, so no figure from it is quoted here.
Single-name volatility
Saxo’s one-year implied-volatility ranks, read at Monday’s close, describe a semiconductor complex that walked into Tuesday’s rout carrying the cheapest options it has carried in a year.
- Nothing in the group is braced. Across fourteen semiconductor names the median rank is 25.8, none sits above 50, and more than a third sit below 20. The four closest to the story sit at the bottom: Micron at rank 4.3, Nvidia 7.6, Broadcom 7.9 and TSMC 8.3, each in the lowest tenth of its own year.
- High absolute volatility, low relative volatility. Micron’s implied volatility is 46.5% and Lam Research’s 59.1%, which are large numbers in isolation. Measured against what each name has priced over the past year they are close to the floor, which is the comparison that matters when judging whether an option is dear.
- The large caps that rose are the expensive ones. Within the seven largest technology names the median rank is 57.5, and Meta, up 3.38% on the day, is the richest at 62.4 with implied volatility of 44.4%. Nvidia is the cheapest of the seven. The option market was charging most for the names that gained and least for the names that fell.
Readings predate Tuesday’s Asian session. Past performance is not indicative of future results. Source: Saxo.
Options flow sentiment
Based on end-of-day 12 October - yesterday’s positioning, not today’s price action.
- Single-name flow gave no clean dispersion signature. Semiconductor protection accumulated slowly through multi-month downside strikes in the sector funds rather than through near-dated buying, while the largest single-name put of the session was sold to open in Nvidia. Across the largest technology names the tone was premium collection rather than upside buying.
- Sector and ETF flow ran the other way from the index’s calm. Index put buying across two expiries dominated the session’s cleanest directional prints, with no index volatility selling anywhere in the set. Nothing traded in the Korea or memory funds at all.
The honest reading is that the index options book was positioning for the week ahead while spot volatility stayed still, and that conviction across the set was low: six of the ten reports describe the day as unclear or hedging-led.
Where the week's range sits
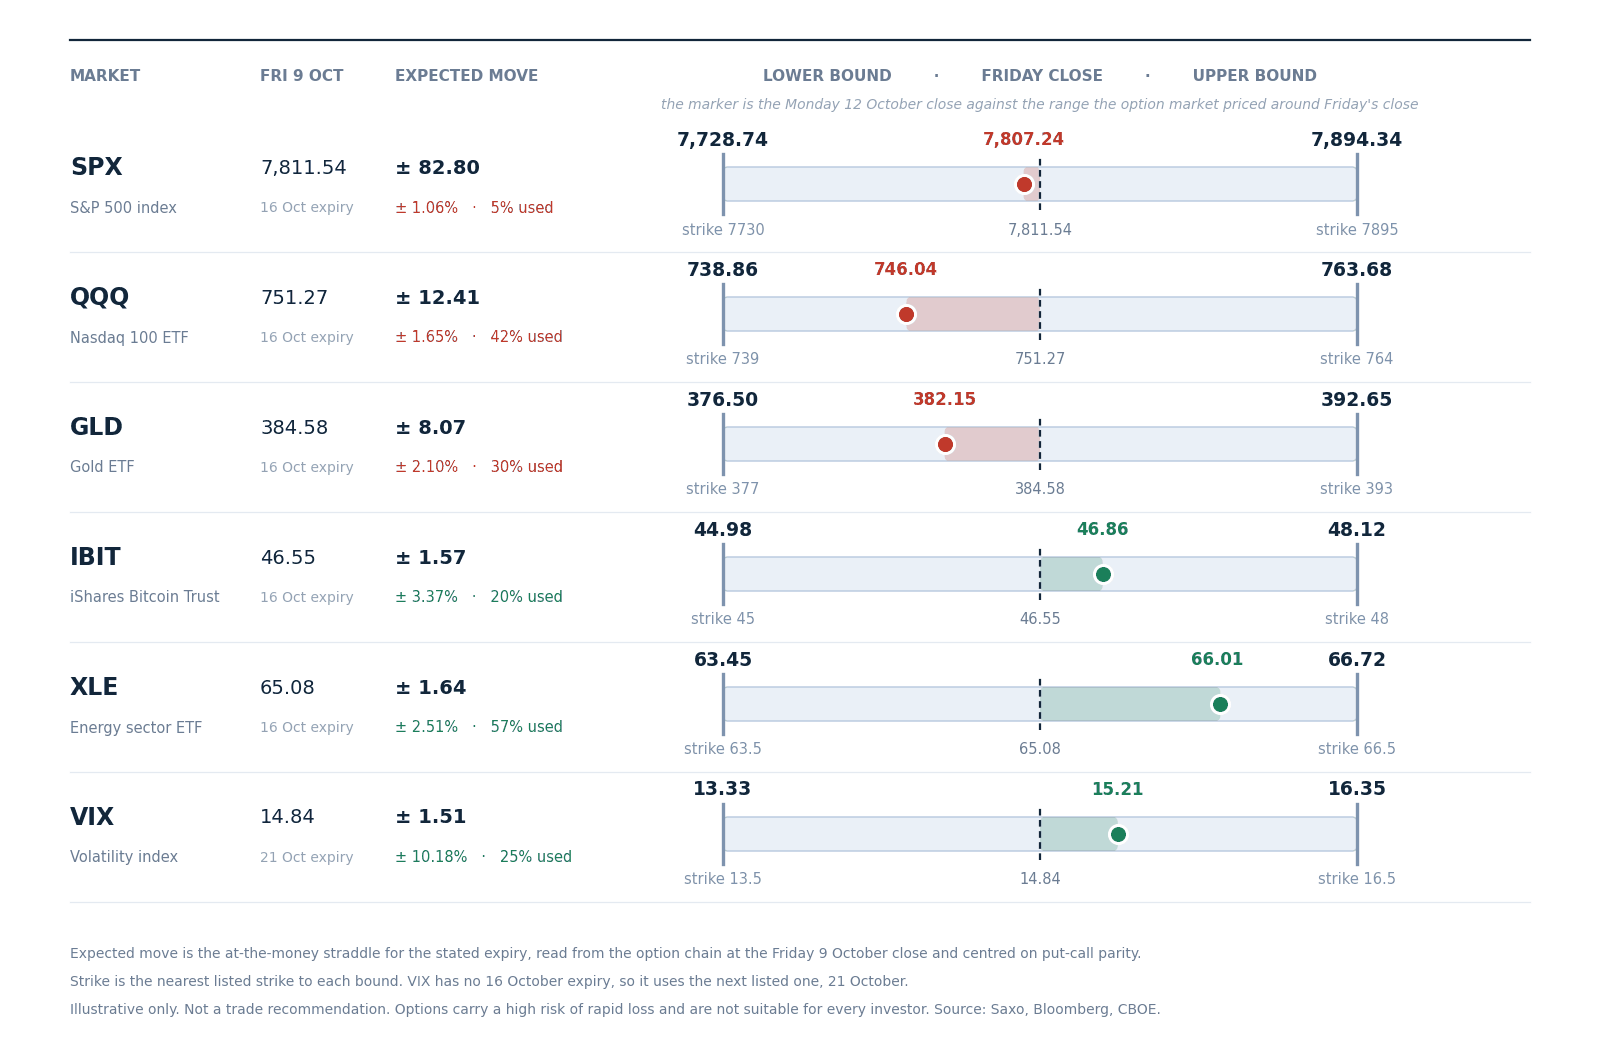
The range the option market priced for this week around Friday 9 October’s close, with the nearest listed strike at each bound and the Monday 12 October close as the marker. Figures are at-the-money straddles read from the Saxo chain at Friday’s close and centred on put-call parity. Illustrative only, not a trade recommendation. Source: Saxo, Bloomberg, CBOE.
One session into the week, the six markets have used very different fractions of what was priced for them. The S&P 500 has used 5% of its 82.80-point range, which is the number that captures the session: a seven percent break in Korea and a two percent fall in semiconductors left the index essentially where Friday left it.
The Nasdaq 100 fund has used 42% of its 12.41-point range and the energy fund 57% of its 1.64-point range, so the week’s movement so far has been a sector story told through two of the six rows. Gold has used 30%, bitcoin’s fund 20% and the VIX 25%.
Options carry a high risk of rapid loss and are not suitable for every investor. Costs and charges apply and vary by account and venue; check the rates applicable to you before entering any position.
Today's catalysts
- Earnings before the open: Citigroup, Goldman Sachs, JPMorgan and Wells Fargo, alongside Johnson & Johnson and UnitedHealth, the first substantial read on the quarter.
- Fed speakers through the session: Waller at 09:45 CET, Barkin at 19:00 CET and Collins at 22:00 CET.
- Second-tier US data: weekly ADP employment at 14:15 CET, existing home sales at 16:00 CET and the monthly budget statement at 20:00 CET.
- Tomorrow, and the reason the nine-day measure rose: September consumer price data at 14:30 CET, with headline inflation expected at 3.7% against 3.4%, and ASML, Bank of America and Morgan Stanley reporting. Producer prices and retail sales follow on Thursday with TSMC, and the Fed chair appears at the IMF on Friday.
Earnings scorecard
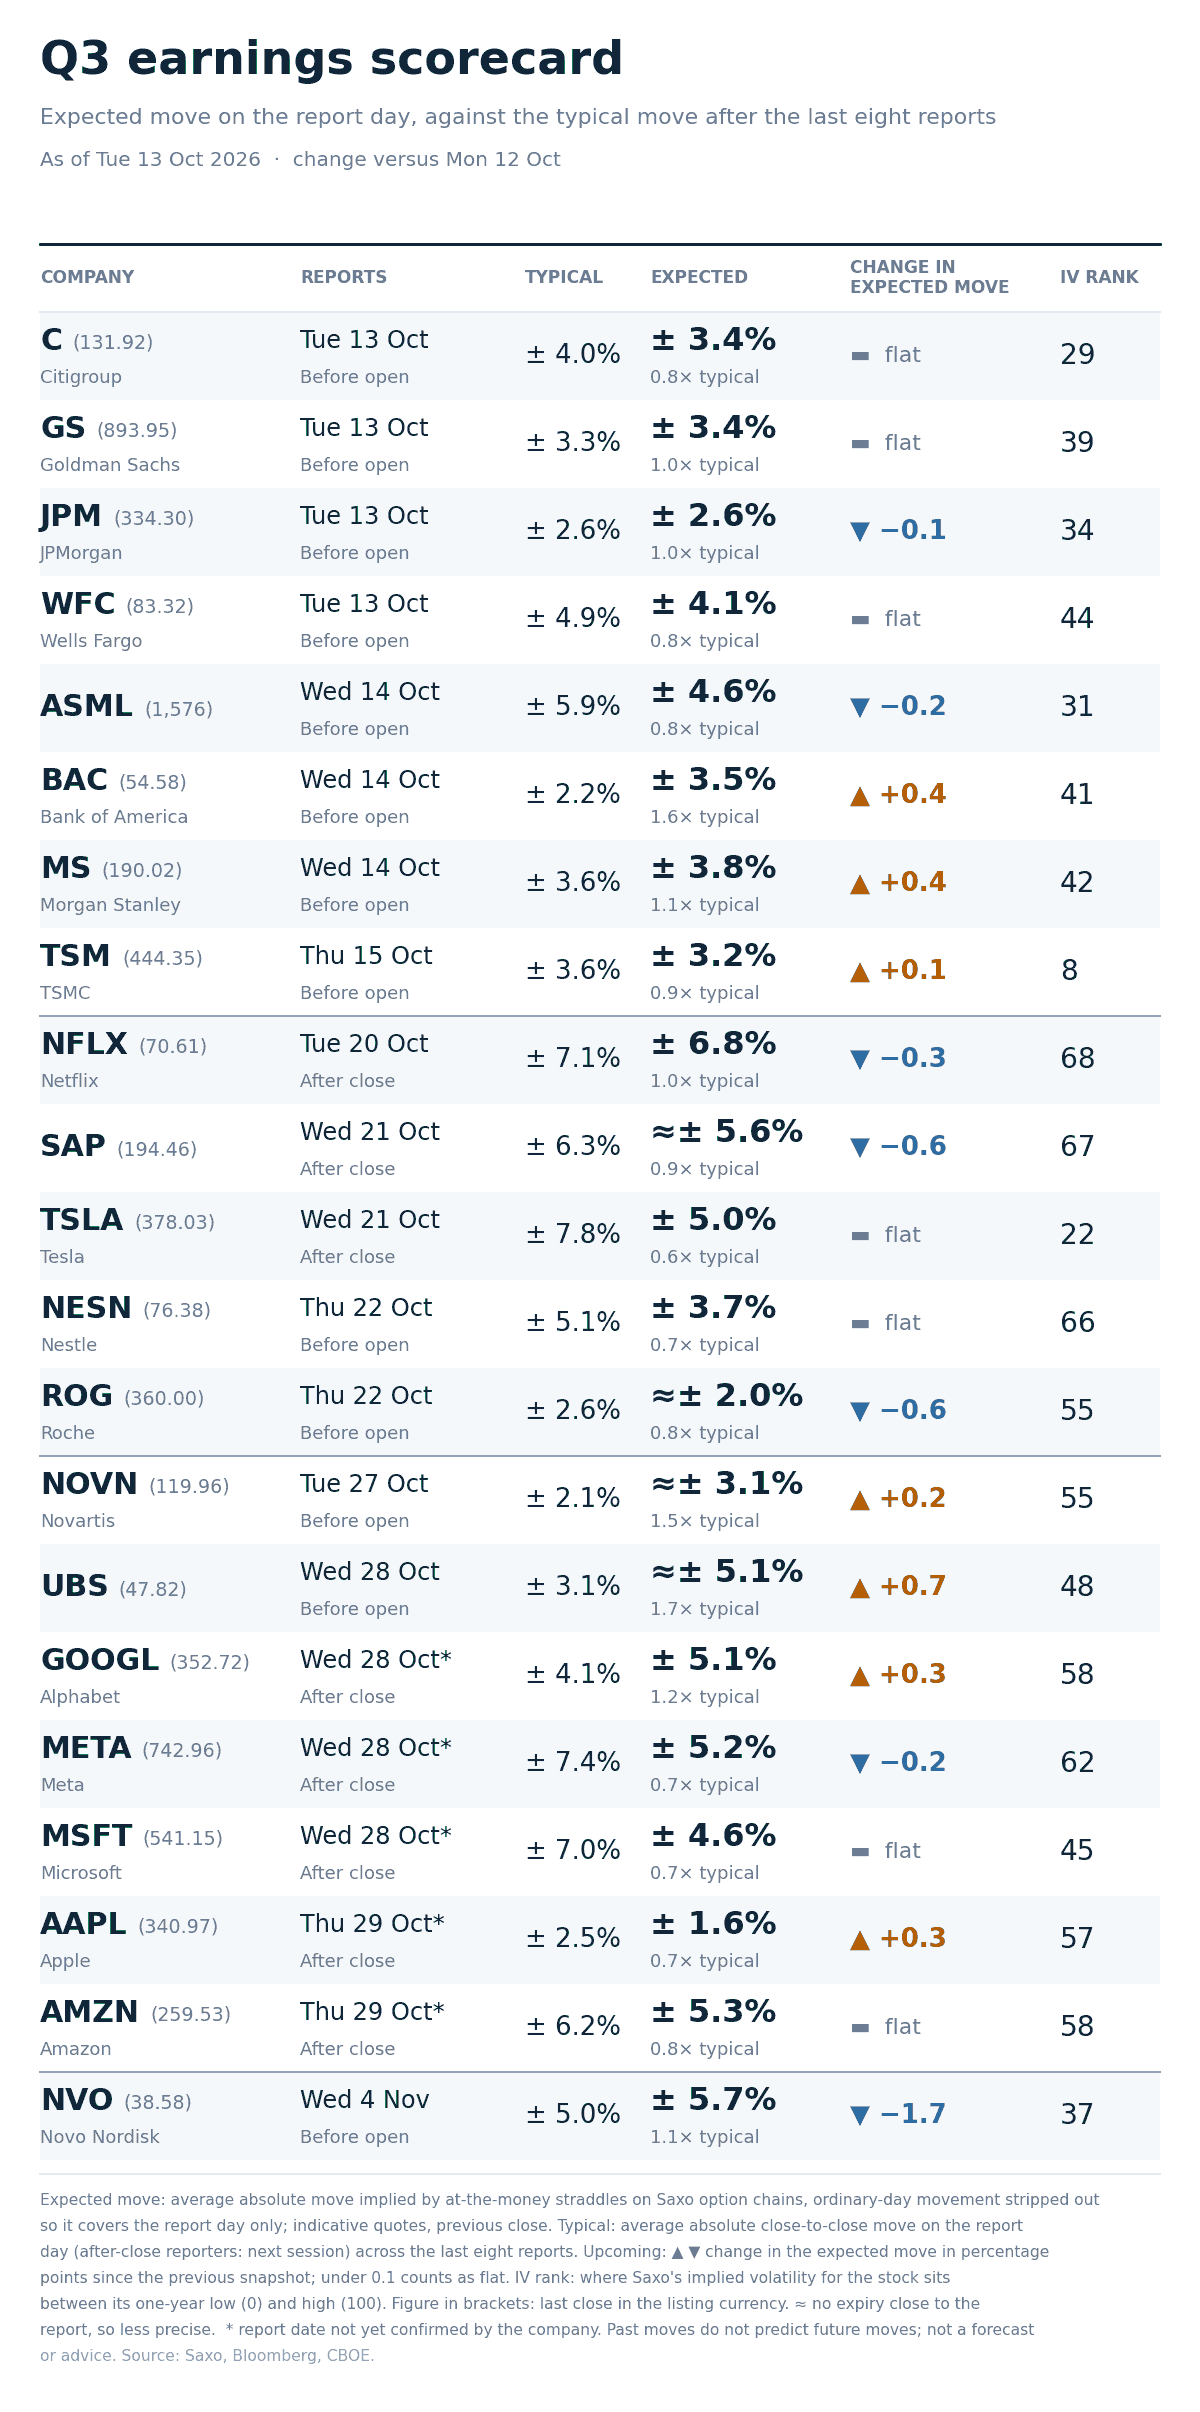
Option-implied expected move for each company’s report day against the average move after its last eight reports, with implied-volatility rank and the last close, as of 13 October 2026. Illustrative only, not a trade recommendation. Source: Saxo, Bloomberg, CBOE.
- The spread between priced and realised is widest at both ends of the bank complex. Bank of America prices 3.5% against an eight-report average of 2.2%, the largest premium this week, while Wells Fargo prices 4.1% against 4.9%. The two report a day apart.
- Rank and premium answer different questions, and here they disagree. TSMC’s implied-volatility rank is 8, near the bottom of its year, while its report prices 3.2% against a 3.6% history. Rank describes the level against the name’s own past; the expected move describes what one day is worth. A name can be cheap on the first and fully priced on the second.
- Of the four reporting this morning, Goldman Sachs and JPMorgan price in line with their histories, Citigroup below at 3.4% against 4.0%, and Wells Fargo carries the highest rank at 44.
Options carry a high risk of rapid loss and are not suitable for every investor. Costs and charges apply and vary by account and venue; check the rates applicable to you before entering any position.
What the market is pricing
- Session implied range: today’s expiry prices 27.0 index points, or 0.35%, centred on a parity forward of 7,808.05. A narrow day, matching an empty calendar.
- Event implied range: Friday’s expiry prices 70.6 points, or 0.90%, covering tomorrow’s inflation data and most of this week’s reporting. A session earlier the same expiry priced 82.10 points with one more session to run, where decay alone would have left about 73.43. Roughly 2.8 points came out beyond what the clock explains.
- Tail risk signal: SKEW at 155.06 sits in the upper part of its recent range, so the cost of far downside protection has not followed the front of the curve lower.
- Correlation read: three-month implied correlation at 11.75 remains very low and dispersion at 36.00 was unchanged, which is what let a two percent fall in semiconductors coexist with a flat index.
In our view the week’s question may be whether tomorrow’s inflation print is what makes the components agree again. The market has priced today as empty and the following nine days as full, and the gap between a VIX1D of 7.72 and a VIX9D of 11.68 states that as plainly as the board allows.
Options carry a high risk of rapid loss and are not suitable for every investor. Costs and charges apply and vary by account and venue; check the rates applicable to you before entering any position. Past performance is not indicative of future results.
This material is produced for informational and educational purposes only and does not constitute investment advice or a recommendation to buy or sell any instrument. Options involve significant risk and are not suitable for all investors. Figures quoted are derived from option-implied pricing at the stated snapshot times and may change rapidly.
| More from the author |
|---|