
You can access all of our platforms from a single Saxo account.

Chip doubts land in the tail, not the index - Options Brief - 9 October 2026

Summary: One private company’s revenue number took 3.4% out of the semiconductor index. The option market answered in the wing and in the Nasdaq, and left the index gauge sitting on its own median.
A revenue number at one private company took 3.4% out of the semiconductor index. The S&P 500 lost less than half a percent, and the average stock in it rose.
MARKET REGIME: LOW VOL BULL | VIX 15.41 | TERM STRUCTURE: CONTANGO | SKEW: ELEVATED (149.19) | FRONT-MONTH VIX FUTURES: 17.50
Key findings
- The decline had one address. The S&P 500 fell 0.47% while the equal-weight version rose 0.60%, the semiconductor fund lost 2.84% and the memory gauge 5.13%.
- Equity volatility rose at every tenor and everything else fell. VIX1D gained 10.11%, SKEW 5.18% and VXN 4.67%, against gold volatility down 3.04% and rate volatility 1.80%.
- The futures curve is as flat as our window has seen. The front contract at 17.500 sits at 0.977 of the second, higher than only 1 of 60 stored sessions.
- Next week’s reports are priced unevenly. Bank of America prices 3.5% for Wednesday against a typical 2.2%, the widest premium against a name’s own record on the board.
Headline driver
The trigger was a correction, not a result. Reports put OpenAI’s annualised revenue run rate near USD 50 billion, about USD 20 billion below figures circulating among investors, and the read-through into capital spending did the rest. The Philadelphia Semiconductor Index fell 3.4%, Broadcom 4.35%, Advanced Micro Devices 3.90% and Nvidia 2.94%. Oracle lost 5.6%, its weakest since 16 July.
Nothing in the data argued for it. Initial jobless claims fell 2,000 to 197,000 in the week to 3 October against a 200,000 consensus, a fourth straight week under 200,000 and the lowest since July. Fed Governor Christopher Waller said further increases will likely be needed, though officials need not move at consecutive meetings.
Two slower stories sat underneath. The Congressional Budget Office pushed back on the view that growth alone stabilises the debt path, and Hurricane Isaias began disrupting Gulf oil production.
Market snapshot
- US (Thursday 8 October close): The S&P 500 fell 0.47% to 7,765.36 and the Nasdaq 100 1.39% to 30,725.81, its worst session since 18 August. The Dow rose 0.10% to 51,237.11 and the Russell 2000 held at 2,794.13. Breadth went the other way, the equal-weight index up 0.60%. Energy led at 2.97%, exploration 2.79% and financials 0.89%. Coherent lost 9.6%.
- Europe: A second decline, with banks the weight. The Stoxx Europe 600 fell 0.75% to 625.52, its lowest close since 11 June, and the Euro Stoxx 50 0.87% to 6,126.74. The banks index lost 2.26% to 289.23. The DAX fell 1.18%, the Swiss market 1.24% and the BEL 20 2.32%.
- Asia (Friday morning): Korea is weakest again, the Kospi down 2.62% to 6,625.93 on memory names, with the Korea fund off 4.03%. Hong Kong rebounded, the Hang Seng up 1.09% to 24,045.71 and its technology sub-index 1.55%. The CSI 300 fell 1.27%.
- Commodities and rates: Gold trades near USD 4,200 and silver near USD 60, with gold holdings at a four-year high. Brent trades near USD 103 after testing USD 106 on Thursday. The ten-year Treasury yield sits at 5.22% after reversing off a test above 5.35%, the two-year at 4.75%.
Source: Saxo, Bloomberg, CBOE. Levels as of the 8 October close unless stated. Yield levels come from the published close, not the export’s change column. Past performance is not indicative of future results.
Volatility surface
Every equity measure rose and every other one fell.
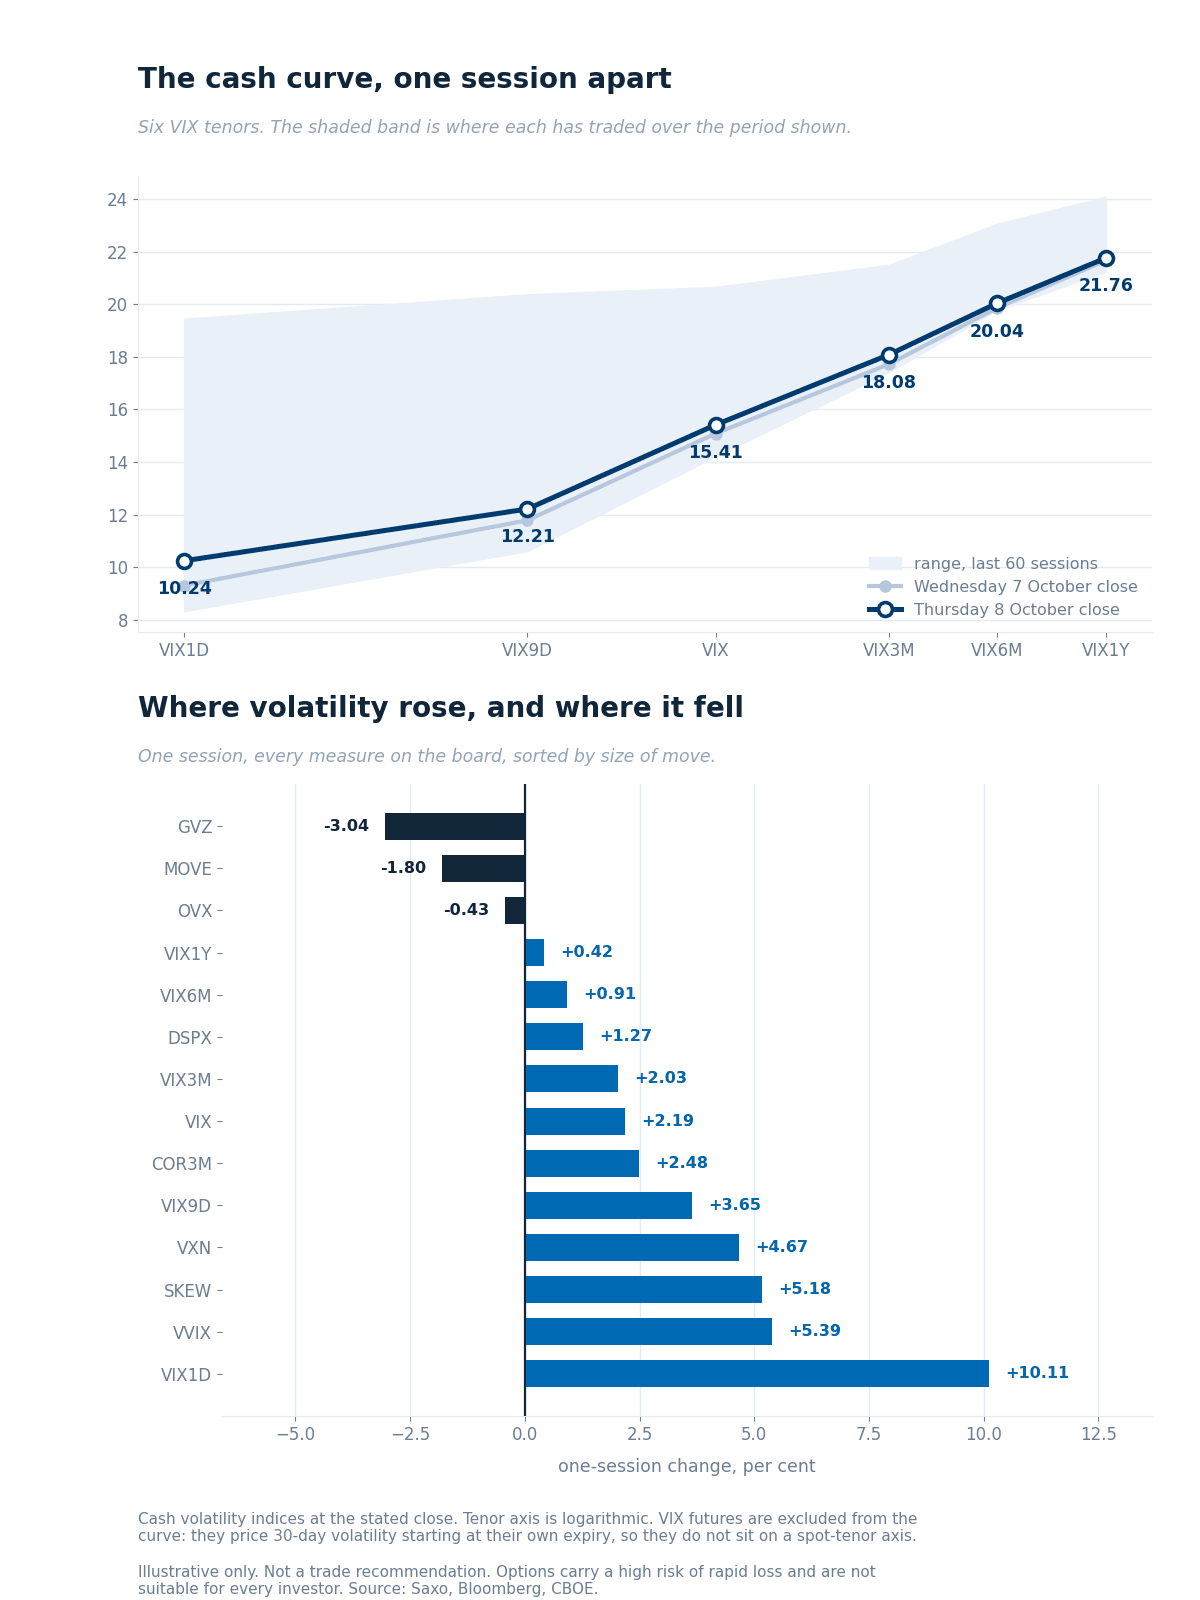
The cash volatility curve at the Thursday 8 October close against the Wednesday close, with the range of the last 60 stored sessions behind it, and the one-session change in every measure we track. Read at approximately 06:00 CET.
Reading the curve
The whole equity curve lifted, most at the front. VIX1D rose 10.11% to 10.24 and VIX9D 3.65% to 12.21, against 0.42% at the one-year tenor. The spot index at 15.41 sits on its own three-month median, with 24 of 60 higher. The price of volatility moving came off the floor, VVIX up 5.39% to 87.66, back to its median after reading lower than all 60 stored sessions two days ago.
The extremes are where they already were. Rate volatility eased 1.80% to 100.71 and still beats all but 9 of 60 against a median of 76.18. Dispersion at 36.57 beats all but 8, implied correlation at 11.56 all but 9, SKEW at 149.19 all but 12. Gold volatility at 22.68 sits a quarter point off its floor.
VIX futures
The front contract settled at 17.500, which the nearest listed expiry confirms at 17.58 on put-call parity, so the series has not rolled. Its premium to spot narrowed to 2.09 from 2.33, even as spot rose. The front-to-second ratio at 0.977 is higher than only 1 of 60, the flattest front our window has seen.
Source: Saxo, Bloomberg, CBOE, 9 October 2026, approx. 06:00 CET. Past performance is not indicative of future results.
Single-name volatility
The names that did the moving carry the cheapest volatility on the board.
Of the fourteen semiconductor names we track, not one has an implied-volatility rank above 50, and the median is 30.5. Nvidia sits at 11.6, Taiwan Semiconductor at 12.7, Broadcom at 16.5 and Micron at 6.3, the four cheapest in the group, and three of those four led Thursday’s fall.
The ranks did rise, from a low base. The semiconductor fund gained 7.4 points of rank on the session, Nvidia 5.8 and Taiwan Semiconductor 5.5, with the group median up 3.7.
The contrast across sectors is sharper than the index measures suggest. Two-thirds of the energy names carry ranks above 50, with a median of 54.7, on the day energy led the market higher. In the semiconductor group that share is zero. Among the large technology names the median rank is 59.3, and Nvidia is the cheapest of the seven.
One caveat on reading the divergence column. Nvidia, Broadcom and Micron price implied volatility slightly above their realised, while Texas Instruments, KLA and Qualcomm price it 30 points or more below. In our view a low rank and a negative divergence answer different questions, and a name can be cheap against its own year while still charging more than it has lately delivered. Source: Saxo.
Options flow sentiment
Based on end-of-day 8 October, Thursday’s positioning and not today’s price action.
Ten reports, and nine of them read as unclear. The size again sits in deep in-the-money structure, rolls and mid-market crosses, so the extreme put premium shares are strike artefacts rather than protection.
- One print carries a provable side and it points the same way as the session. A March 2027 Nvidia put traded USD 40.1 million on the ask, on volume more than six times the open interest at that strike.
- Across the large technology names, every explicit opening purchase in the retained set was a put, and there was no explicitly bought call anywhere.
- No index or volatility product appears in the set at all, so the tail bid the surface shows has no footprint in yesterday’s tape.
Where the week's range sits
What the option market priced for this week, drawn around Friday’s close.
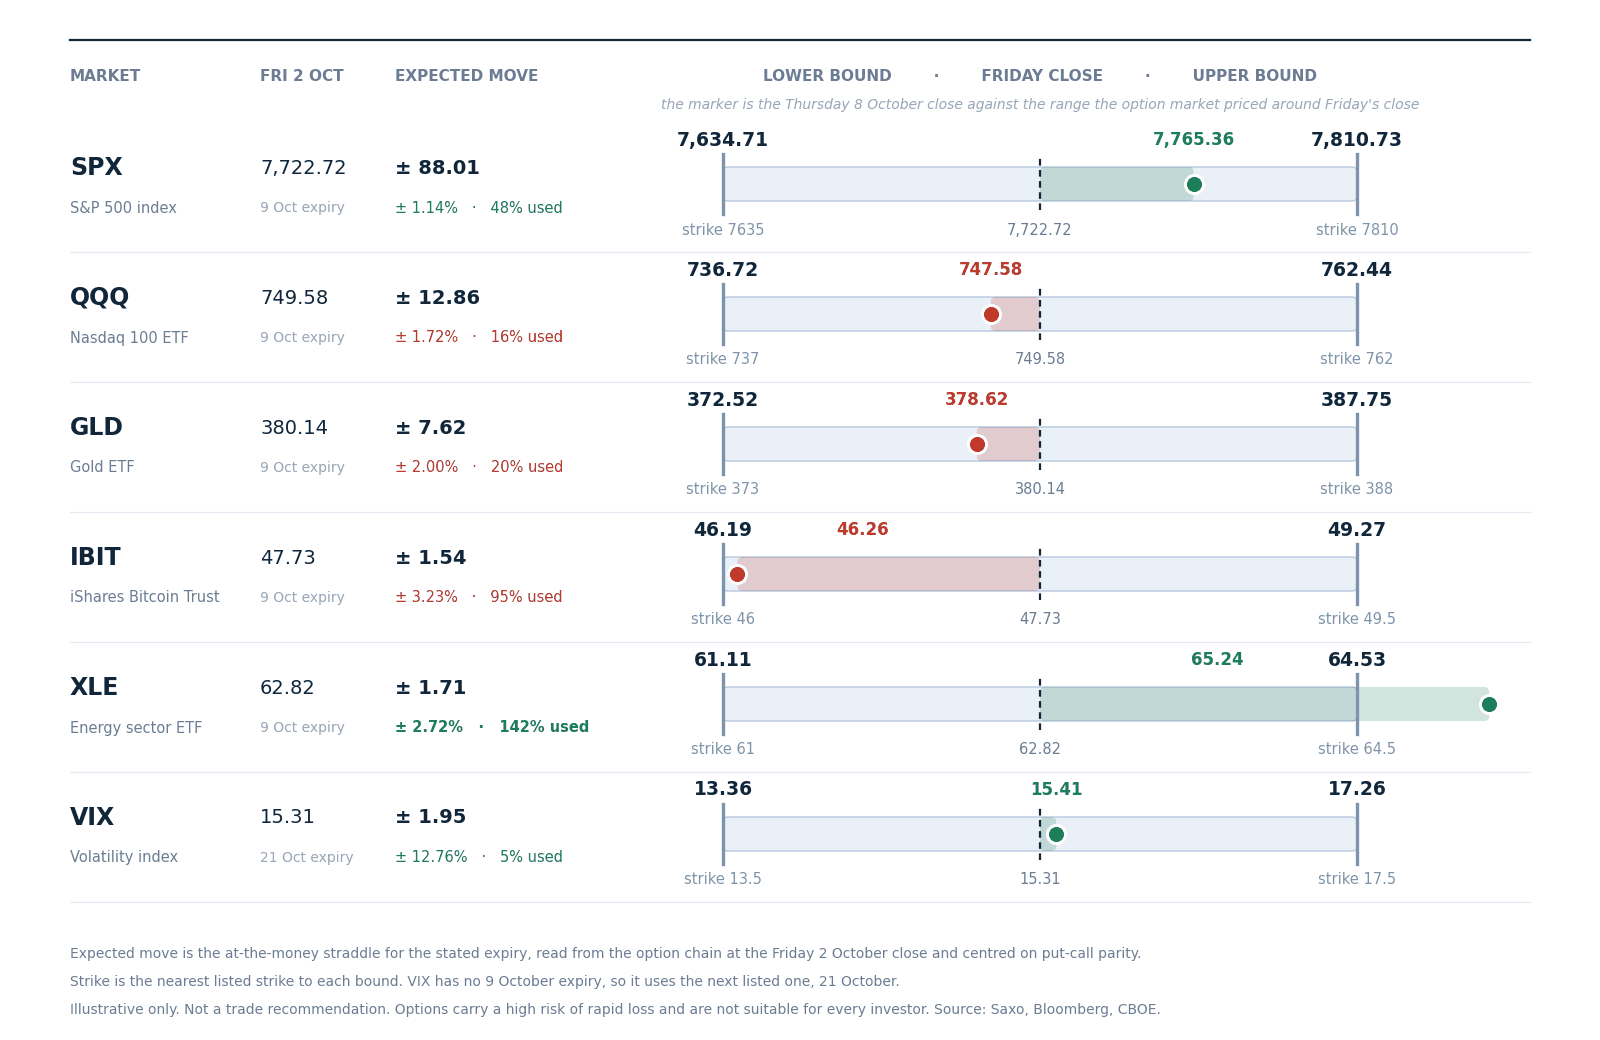
Expected move to Friday 9 October, drawn around the 2 October close with the nearest listed strike at each bound, derived from option-implied pricing. Volatility uses the 21 October expiry, which is the next listed one. Read from the chain at Friday’s close, not a forecast.
- The index spent less than half of what was priced. The S&P 500 sits 48% of the way to the band top drawn around Friday’s 7,722.72, and the Nasdaq 100 fund has used 16%, which leaves it near where the week started despite Thursday.
- The edges did the travelling. Energy has used 142% of its band, through the upper bound, and the bitcoin fund 95% of its band downward, against 20% for gold and 5% for volatility.
- The same shape repeats one level down. In our assessment a week in which the index uses half its range while two sectors spend all of theirs describes the dispersion the correlation reading prices. It is not a forecast of where any of them closes. Options carry a high risk of rapid loss and are not suitable for every investor; see Saxo pricing for costs and charges.
Today's catalysts
The US cash session runs 15:30 CET to 22:00 CET. The preliminary University of Michigan sentiment reading for October arrives at 16:00 CET, August factory orders follow, and Kansas City Fed President Jeffrey Schmid speaks. Delta Air Lines reports.
That is a thin Friday, and it sits in front of a heavy week. September inflation data is due on Wednesday 14 October, the large US banks begin reporting on Tuesday, and the Federal Reserve’s quiet period starts on 17 October ahead of the late-October meeting. Future outcomes are uncertain and may result in losses.
Earnings scorecard
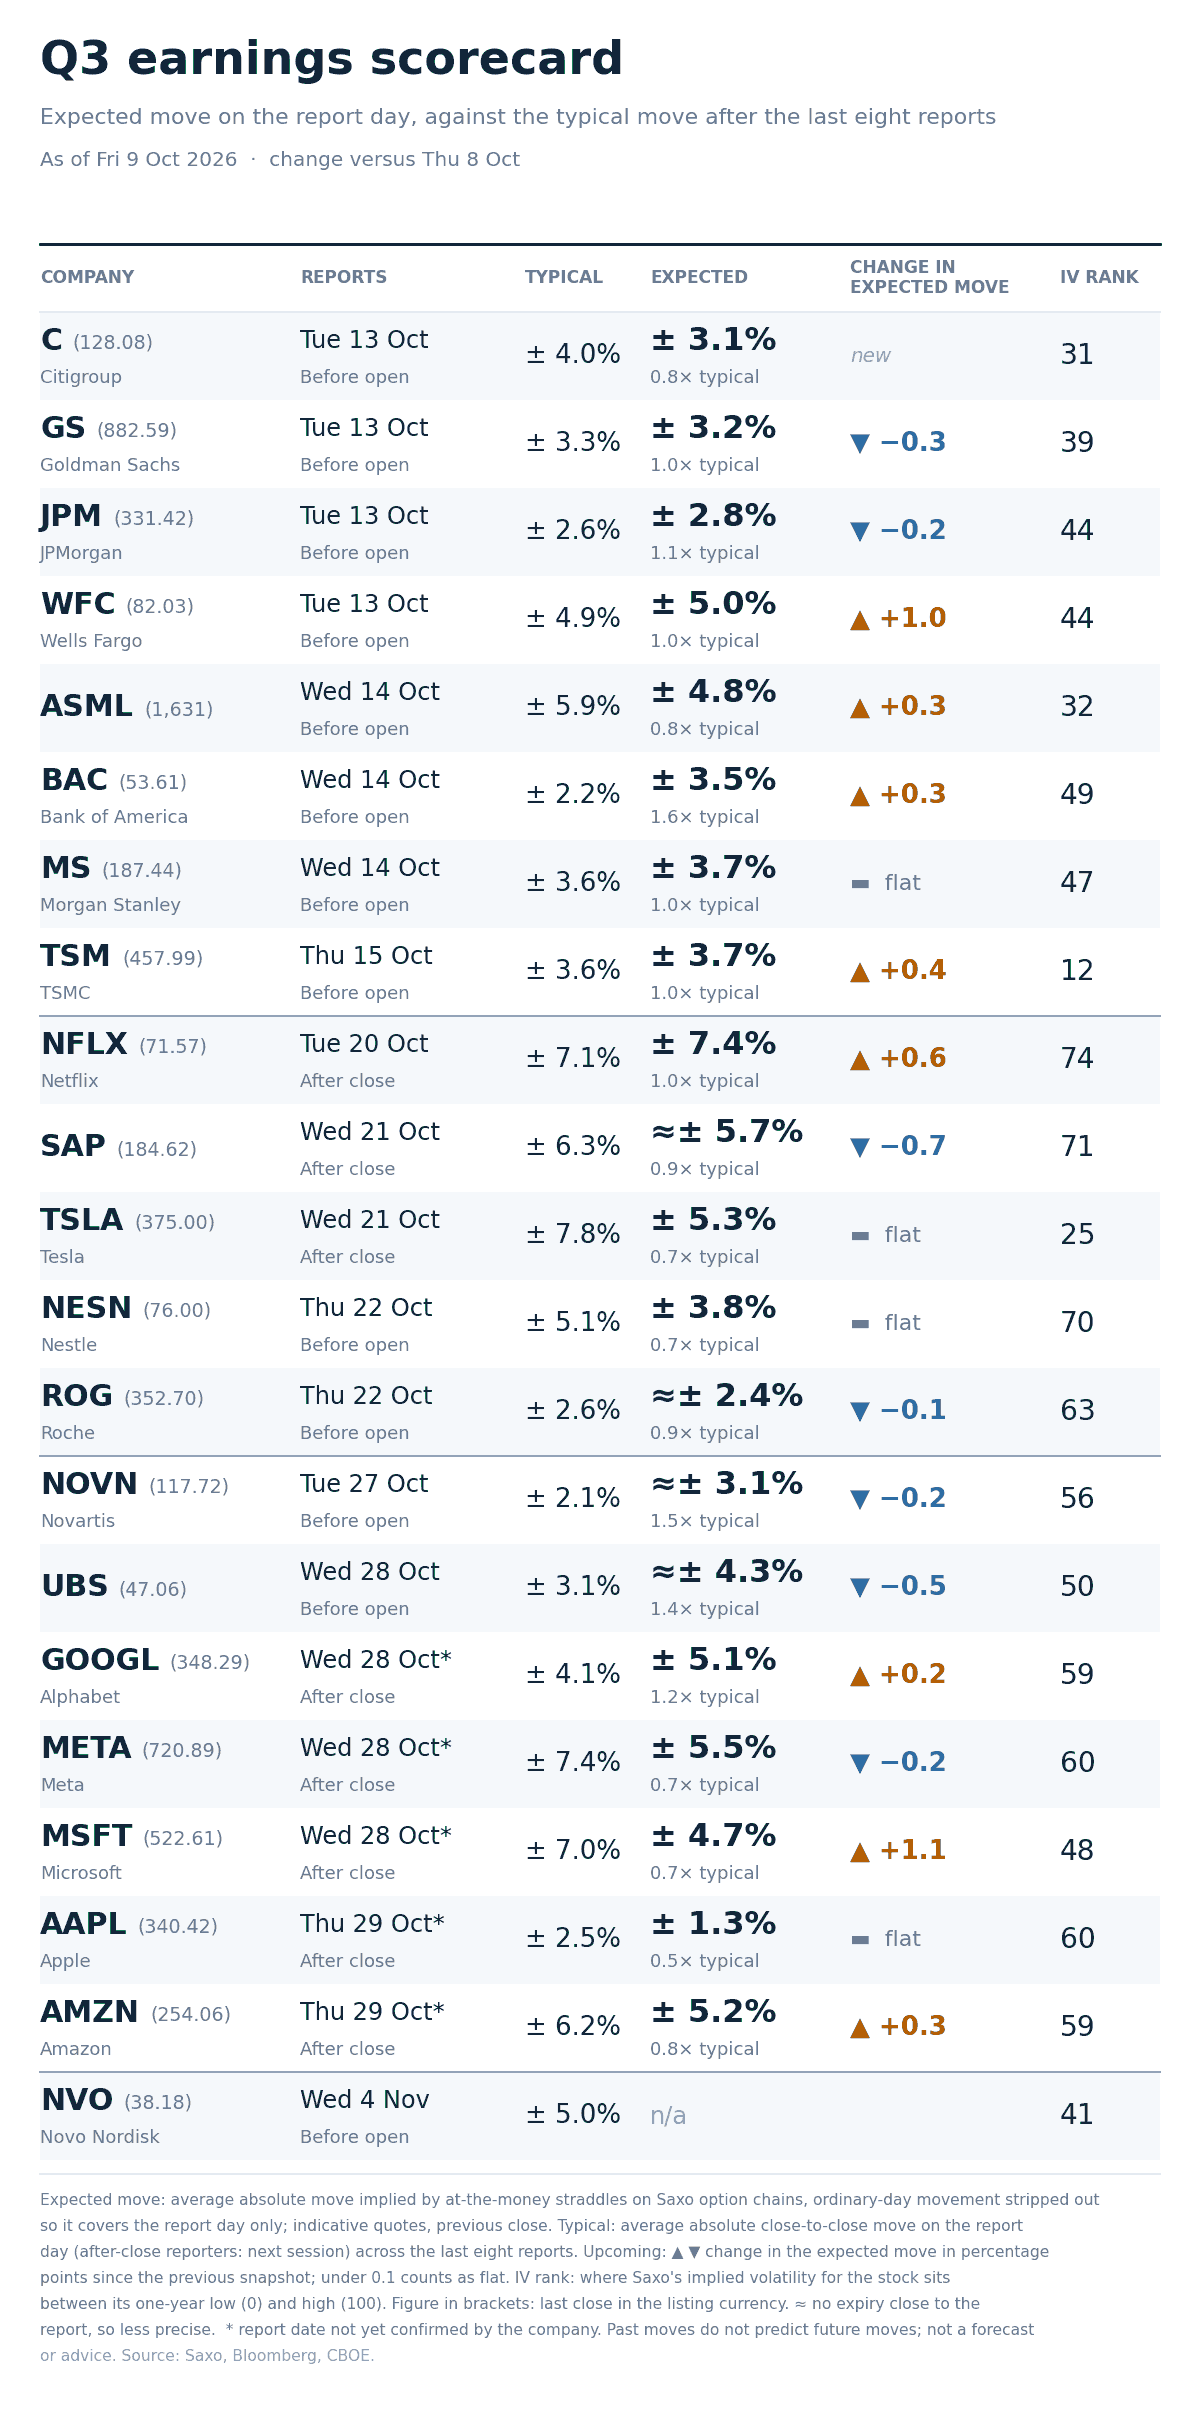
Expected move on each report day against the stock’s average move after its last eight reports, with implied-volatility rank and the last close, read from Saxo chains at approximately 06:00 CET. Quotes before the US open are indicative.
- The spread between priced and typical is widest at the two ends of next week. Bank of America prices 3.5% against a typical 2.2% and Novartis 3.1% against 2.1%, while Apple prices 1.3% against 2.5% and Tesla 5.3% against 7.8%.
- Rank and event premium keep disagreeing, which is the column’s point. Apple carries a rank of 60 and the cheapest report on the board relative to its own record, so the volatility sits in the stock rather than in the event. Taiwan Semiconductor runs the other way at rank 12 with a report priced in line with its history.
- Six of the names report inside five sessions. The four large banks open on Tuesday 13 October, ASML, Bank of America and Morgan Stanley follow on Wednesday, and Taiwan Semiconductor on Thursday. Options carry a high risk of rapid loss and are not suitable for every investor; see Saxo pricing for costs and charges.
What the market is pricing
- Session implied move. SPXW options price 36.05 points, or 0.464%, to tonight’s close and 99.00 points, or 1.275%, to Friday 16 October, derived from option-implied pricing. Quotes before the US open are indicative.
- What the clock did not explain. Today’s expiry priced 47.55 points yesterday and 36.05 now, where decay alone leaves about 33.6. The market added about two and a half points beyond the clock, so implied volatility for this expiry rose.
- Tail risk signal. SKEW at 149.19 gained 5.18% and the tail index 12.10%, against 2.19% for spot volatility. In our view the bid went to the wing rather than the index.
- Correlation read. Implied correlation at 11.56 and dispersion at 36.57 both sit in the top sixth of their three-month ranges. In our assessment the market may be paying for single names to move and for the index to move with them.
The surface and the tape disagree. The option market repriced the wing, the front of the curve and the Nasdaq, and left the index gauge at its median. Positioning showed none of it.
In our view that gap closes either way, and the week’s range is unevenly spent. Options carry a high risk of rapid loss and are not suitable for every investor.
Important note: The strategies and examples provided in this article are purely for educational purposes. They are intended to assist in shaping your thought process and should not be replicated or implemented without careful consideration. Every investor or trader must conduct their own due diligence and take into account their unique financial situation, risk tolerance, and investment objectives before making any decisions. Remember, investing in the stock market carries risk, and it’s crucial to make informed decisions.
| More from the author |
|---|