
You can access all of our platforms from a single Saxo account.

Blue wave meets a one-day premium - Options Brief - 4 November 2026

Summary: The one-day volatility gauge jumped almost 30% into the midterm vote while every longer tenor eased, and futures fell overnight as Democrats took Congress. Was one session of premium enough?
The one-day volatility gauge jumped almost 30% into the midterm vote and closed above every longer tenor, and the result arrived after the bell.
MARKET REGIME: NEUTRAL / CHOP | VIX 20.83 | TERM STRUCTURE: FLAT | SKEW: ELEVATED (150.01) | FRONT-MONTH VIX FUTURES: 21.100
Today in brief
The one-day volatility gauge jumped 29.72% to 23.22 on Tuesday, the second-highest reading in our store, while every longer tenor eased and the VIX slipped to 20.83. Options indicatively price 1.14% for today’s S&P 500 expiry, and by 06:00 CET S&P 500 futures had already fallen about 1.2% as Democrats took both chambers of Congress, close to the whole priced move.
In our view the overnight futures market shows where the premium went next. The November VIX future rose 1.20 points to 21.10 as the results came in, 4.4% above December, the steepest gap of its kind in our store. The 6 November expiry prices 1.68%, a little above the 1.60% that time decay alone would have left from yesterday’s reading.
In our view the reading that may cut the other way is correlation. Implied correlation, a gauge of how closely stocks are expected to move together, closed at a store high of 16.09, and the Nasdaq 100 fund’s volatility rank rose to 84.6 while the typical single name barely moved. That leans toward a premium on technology as a group and on a policy shock, more than on single names.
The S&P 500 rose 0.36% to 7,568.92 on Tuesday, using 8% of the week’s band to the downside; this morning’s futures point to about 72%. Apple fell 1.9% after its report, about half what was priced, and Novo Nordisk completes the earnings board today. Tuesday’s flow showed no visible election hedge. The refunding and ISM services land in the US session, with the Bank of England on Thursday and payrolls on Friday. Past performance is not indicative of future results.
That is the whole brief in one read. The sections below hold the detail behind each paragraph, with the charts, the full set of readings and the sources, for when you want to go deeper on one part.
Headline driver
Democrats took control of both the House and the Senate in Tuesday’s midterm elections, with the results arriving after the US cash close. Index futures fell overnight on concern that a Democratic Congress brings tighter scrutiny of technology and AI spending. At 06:00 CET Nasdaq 100 futures were 2.09% below their own settlement and S&P 500 futures 1.18%, and the Kospi had fallen 3.67%.
Tuesday’s cash session came before any of that. Technology recovered, Nvidia rose 2.29%, and Apple fell 1.90% after warning that memory costs would squeeze its margins. Today brings the Treasury’s quarterly refunding and the ISM services index, with the Bank of England on Thursday and payrolls on Friday.
Market snapshot
- US (Tuesday 3 November close): S&P 500 7,568.92, up 0.36%. Nasdaq 100 28,180.26, up 0.68%. Dow Jones Industrial Average 51,792.19, down 0.38%. The equal-weighted S&P 500 fell 0.31%. The technology sector fund rose 1.31% and communication services 1.18%, while materials fell 2.01% and energy 0.85%.
- Europe: the Stoxx 600 fell 0.58% to 645.67, the DAX 0.45% to 25,864.62 and the CAC 40 0.34% to 8,020.31. Euro Stoxx 50 futures traded 1.41% below their settlement at 06:00 CET.
- Asia (Wednesday morning): the Kospi fell 3.67% to 5,441.53 by 06:00 CET and the Nikkei about 1.5%, as the US result weighed on chip stocks. The Hang Seng was flat at 23,529.12.
- Commodities and rates: Brent trades at 103.21 and WTI at 95.65. Gold futures sit at 3,944.10 and silver at 49.19, while copper fell 1.98%. The two-year Treasury yield trades near 4.56%, about three basis points lower, and the ten-year near 4.90%. Bitcoin trades near 76,200.
- Market regime: neutral / chop, the VIX at 20.83, the curve flat and SKEW elevated at 150.01.
Index levels and volatility readings from the watchlist export taken at 06:00 CET on 4 November 2026, which carries Tuesday’s US closes and overnight futures; the Nikkei, single-stock moves and the election result from the same-morning Saxo Market Quick Take. Past performance is not indicative of future results. Source: Saxo, Bloomberg, CBOE.
Volatility surface
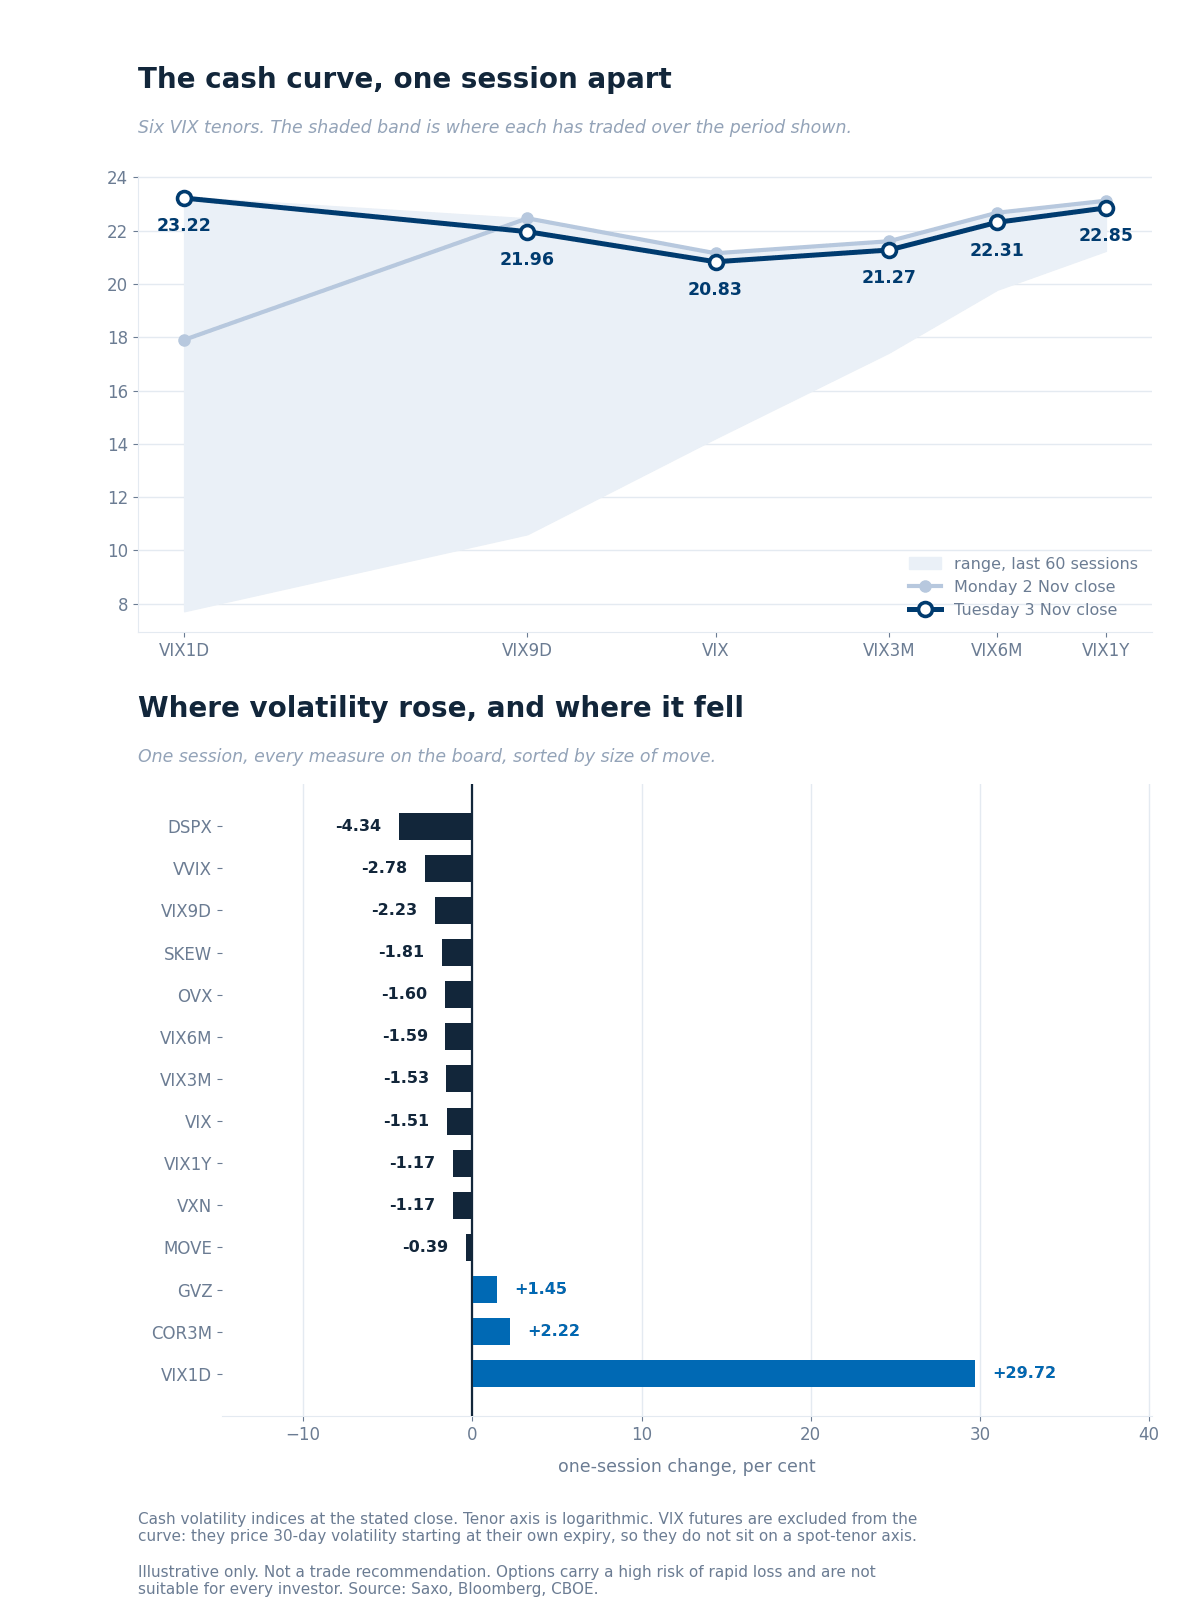
The cash curve at Tuesday’s close against Monday’s, over each tenor’s 60-session range, with the one-session change across every measure. Illustrative only. Past performance is not indicative of future results. Source: Saxo, Bloomberg, CBOE.
The curve tipped forward. The one-day gauge jumped 29.72% to 23.22, the second-highest reading in our 102-session store, while every longer tenor eased: the nine-day 2.23% to 21.96, the VIX 1.51% to 20.83 and the one-year 1.17% to 22.85. VIX futures are left off the chart because each prices a month that starts at its own expiry.
Ratios. The one-day gauge sits at 1.115 times the VIX, only the third reading above one in our store, after the closes of 17 June and 16 October. VIX9D/VIX eased to 1.054 from 1.062. VIX3M/VIX holds at 1.02, level with the store low, and VXN/VIX at 1.47.
VIX futures. November rose 1.20 points to 21.10 overnight as the results came in, the highest in our store, and stands 4.4% above December at 20.22, the steepest such gap we have recorded. Put-call parity on the 18 November options at Tuesday’s close returned 19.96, in line with the 19.90 settlement, so the series has not rolled.
Tails and correlation. SKEW eased 1.81% to 150.01, still above its 145.95 median. Implied correlation rose 2.22% to 16.09, a new store high, while dispersion fell 4.34% to 37.44. The bond gauge held near 100.
Single-name volatility
The typical name barely moved into the vote. On a common set of 522 underlyings the median implied-volatility rank eased to 42.7 from 43.0, and the mean to 46.6 from 46.7, with 299 names up and 208 down.
The Nasdaq 100 fund stood out. Its rank rose to 84.6 from 81.7, the 96th percentile of its year. The S&P 500 fund held at 37.1, but at the 83rd percentile: one spike set the year’s high, and the fund has spent most of the year cheaper than today. In our view the pre-vote premium sat on technology at index level more than on single names.
In our view reports moved names more than politics did. Apple’s rank fell to 49.4 from 84.3 once its report was out, and Palantir’s dropped 61.6 points, the largest fall in the universe. The energy sector fund eased 13.1 points to 80.8. McDonald’s, which reports today, sits at 85.9 and CVS Health at 78.6.
Implied-volatility rank and percentile from the Saxo screener, read overnight to about 03:00 CET on 4 November 2026, carrying Tuesday’s close. Source: Saxo.
Options flow sentiment
Based on end-of-day Tuesday 3 November, yesterday’s positioning, not today’s price action.
- Single-name flow was mostly institutional restructuring with no readable direction; the little with a clear side leaned mildly long in mega-cap technology.
- Sector and ETF flow showed no visible election hedge, with only small, mostly longer-dated defensive put buying and bought energy calls. In our view the flow neither confirms nor contradicts the one-day bid.
Where the week's range sits
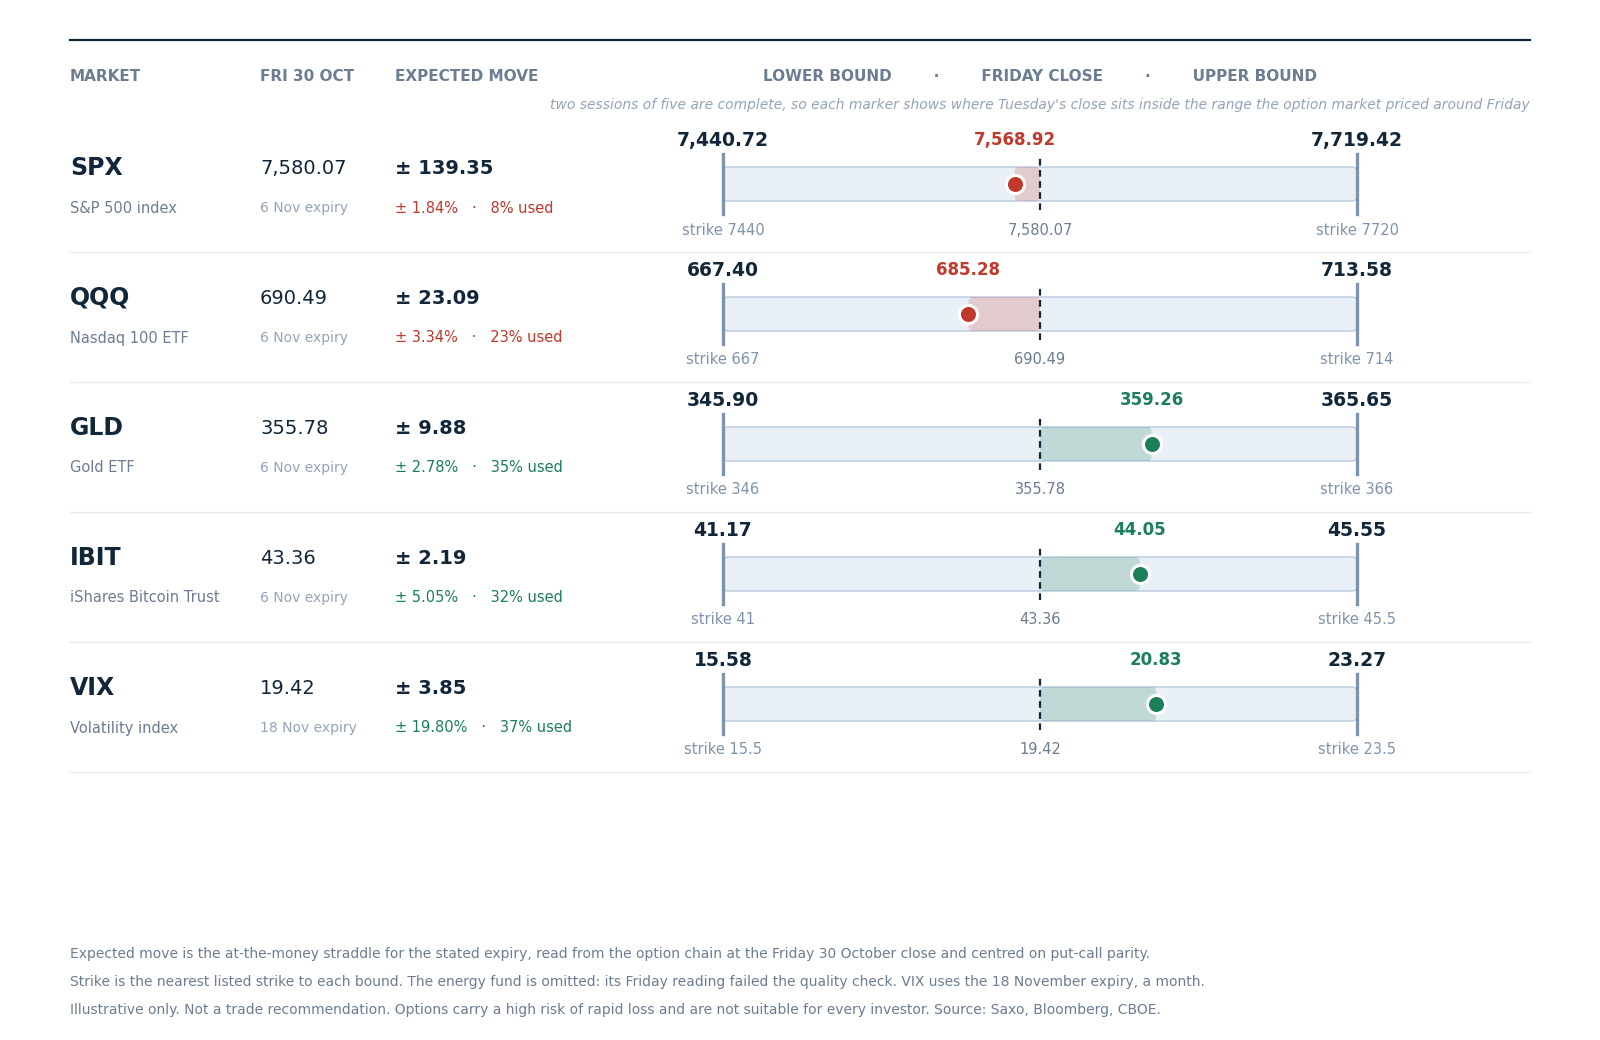
The range the option market priced for this week around Friday 30 October’s close, with each market’s Tuesday close marked inside it. Illustrative only, not a trade recommendation. Past performance is not indicative of future results. Source: Saxo, Bloomberg, CBOE.
The S&P 500 began the week with 139.35 points priced around Friday’s 7,580.07 close, 1.84%, from 7,440.72 to 7,719.42. Tuesday’s close at 7,568.92 had used only 8% of that band to the downside. Futures at 06:00 CET pointed to an open near 7,480, which would use about 72% with three sessions left.
The Nasdaq 100 fund has used 23% of its band downward, gold 35% upward and the bitcoin fund 32% upward. The volatility row uses the 18 November expiry, so it measures a month, not a week, and has used 37% of its band upward. The energy fund’s Friday reading failed our quality check and is left out.
Options carry a high risk of rapid loss and are not suitable for every investor. Costs and charges apply and vary by account and venue; check the rates applicable to you.
Today's catalysts
- 09:30 CET Riksbank rate decision; 11:00 CET euro-zone October inflation.
- 14:15 CET US ADP employment; 14:30 CET the Treasury’s quarterly refunding announcement; 16:00 CET ISM services.
- Earnings today: Qualcomm, Arm, Uber, McDonald’s, CVS Health, AppLovin and Datadog. Novo Nordisk reported this morning.
- This week: the Bank of England on Thursday and US payrolls on Friday.
Earnings scorecard
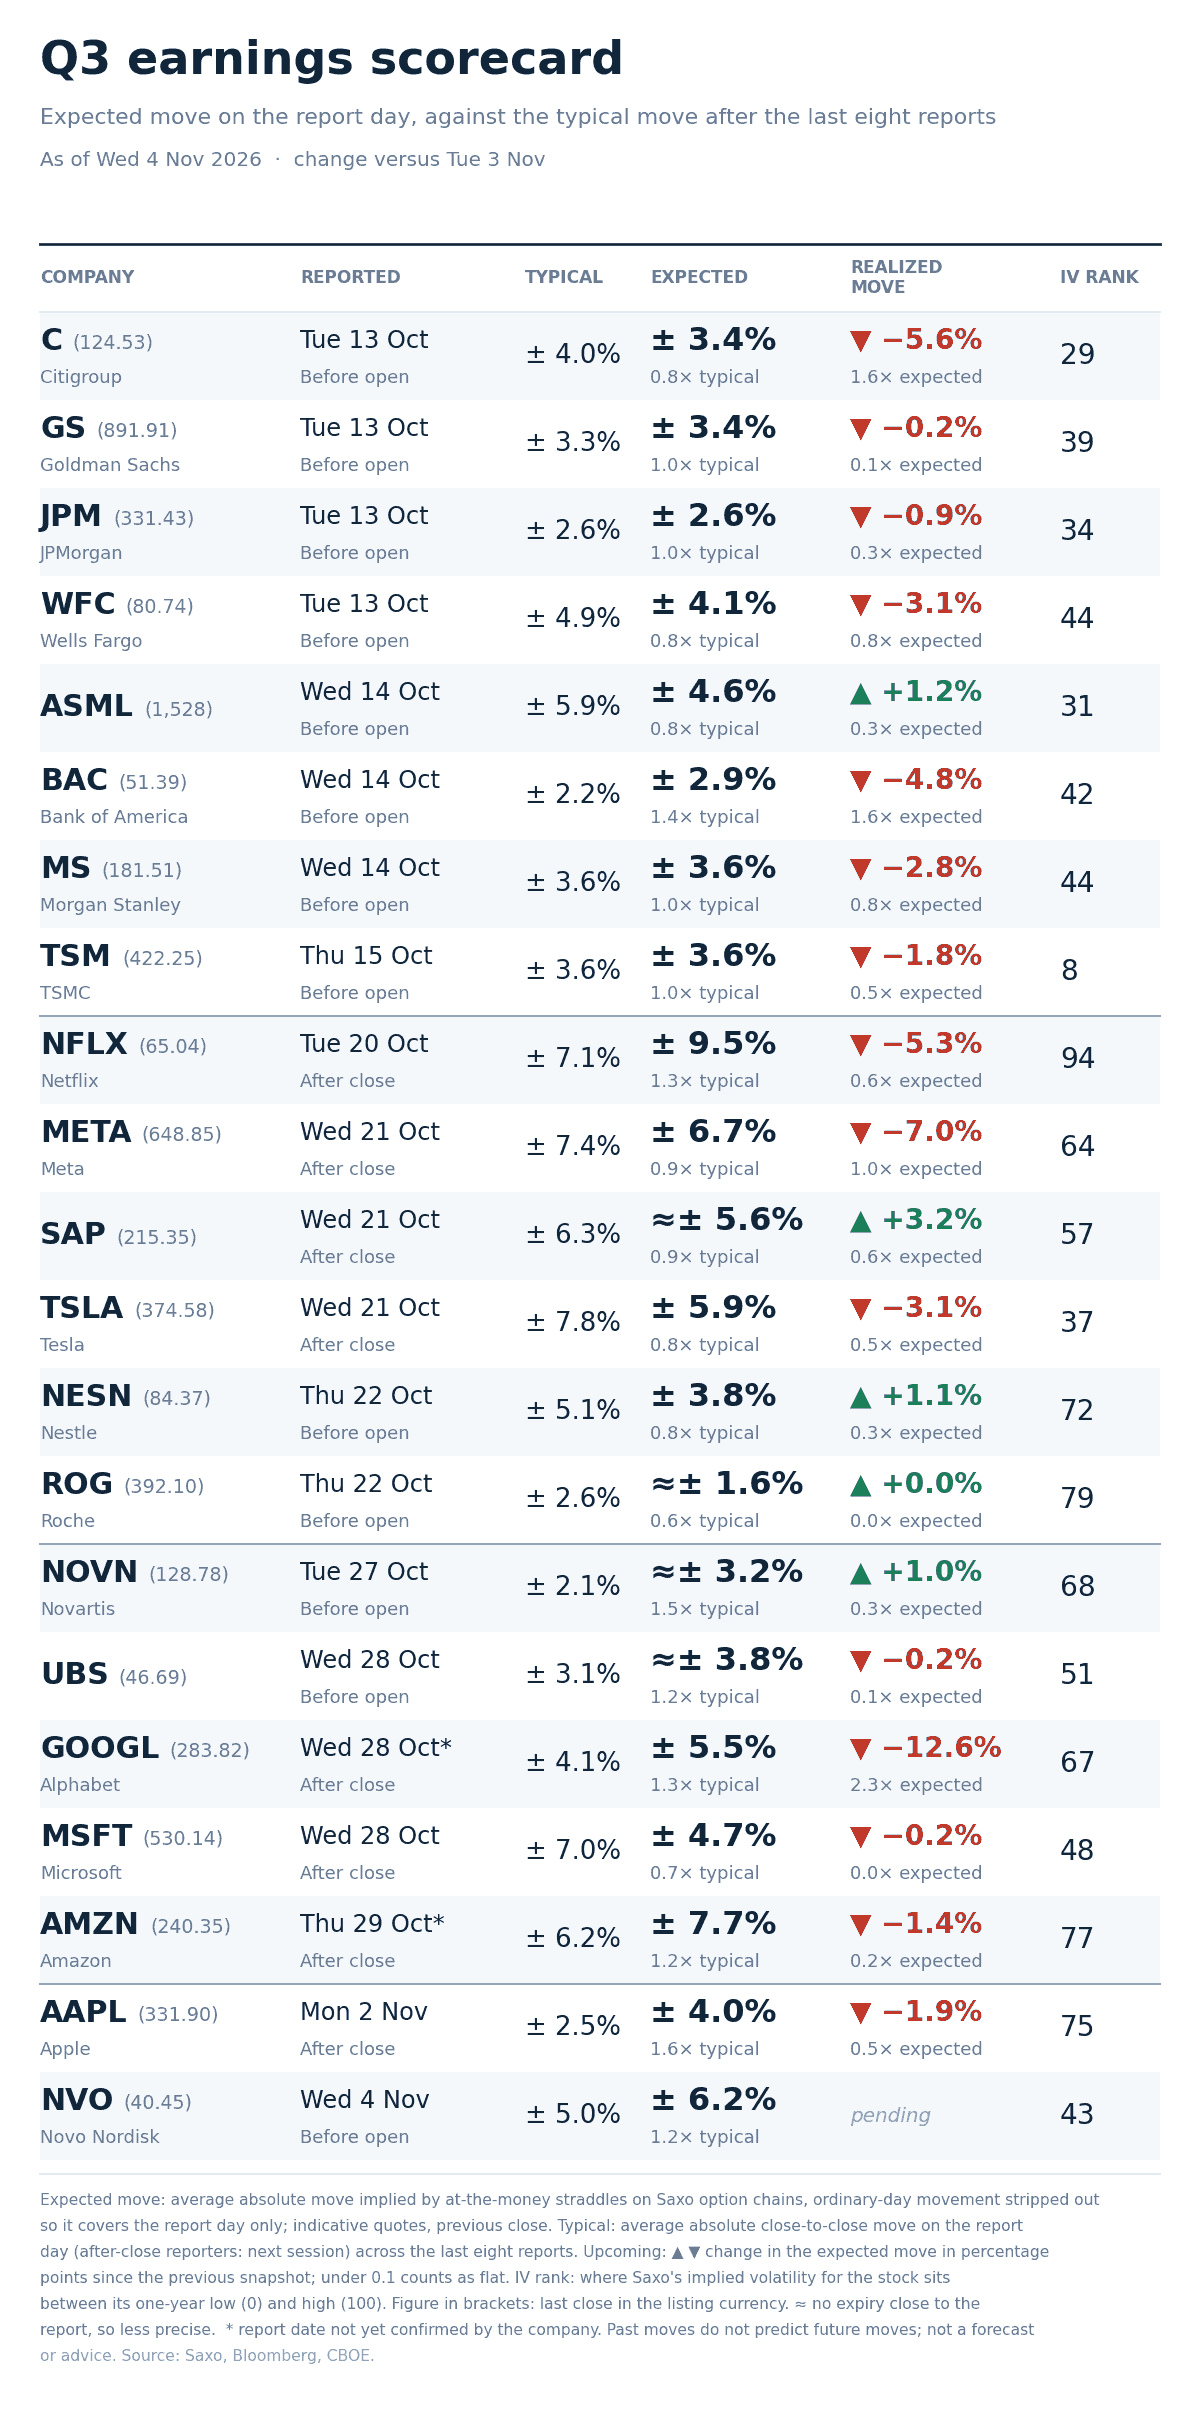
Option-implied expected move for each report day against the stock’s average move after its last eight reports, across the twenty-one names tracked this season. Past performance is not indicative of future results. Source: Saxo, Bloomberg, CBOE.
The season’s board is complete. Novo Nordisk, the last name, reported this morning priced for 6.2% against an eight-report average of 5.0%. Its shares rose about 5% in Copenhagen after it raised its outlook, so the realised move is pending until today’s close.
Apple’s move is now in: it fell 1.9% on Tuesday against 4.0% priced, about half the expected move. That is close to the season’s typical outcome. Across the twenty names with a realised move, the median moved about 0.5 times what was priced, and only four moved at least as much.
Alphabet’s 12.6% fall against 5.5% priced, 2.3 times, remains the largest move relative to its pricing this season.
Options carry a high risk of rapid loss and are not suitable for every investor. Costs and charges apply and vary by account and venue; check the rates applicable to you.
What the market is pricing
- Session implied range: S&P 500 options price 86.20 points, 1.14%, for today’s expiry. The quotes centre on Tuesday’s close, so they are indicative before the open, and futures had already fallen about 1.2% by 06:00 CET, close to the whole priced move. The one-day gauge at 23.22 implies about 1.46%, a one-sigma figure rather than an expected move.
- Event repricing: yesterday the 6 November expiry priced 1.85% with four sessions to run. Time decay alone would have left about 1.60%. Today it prices 1.68%, about 0.08 points above decay against about 0.20 a day earlier, so in our view the market added premium to the week for a third day, though less of it.
- Curve read: the one-day gauge sits 11.5% above the VIX, while the nine-day and three-month sit 5% and 2% above it. In our view that leans toward a market paying for the first session after the result more than for a longer stretch of stress.
- Correlation read: implied correlation closed at a store high while dispersion fell. In our view that suggests the market expects stocks to move more as a group than on their own news, which fits a policy shock more than an earnings one.
In our view today tests whether one session’s premium was enough. Futures had moved about as far as options priced before the open, and the ISM services index and the refunding still land inside the US session. Options carry a high risk of rapid loss and are not suitable for every investor. Costs and charges apply and vary by account and venue; check the rates applicable to you. Past performance is not indicative of future results.
| More from the author |
|---|