
You can access both of our platforms from a single Saxo account.

Sectors pull apart, the index holds - Options Brief - 14 October 2026

Summary: Biotech fell three per cent, energy rose nearly two, and the S&P 500 finished the day where it began. The index was not quiet; its parts were cancelling each other out.
Biotech fell three percent, energy rose two, the index finished flat.
MARKET REGIME: LOW VOL BULL | VIX 15.27 | TERM STRUCTURE: CONTANGO | SKEW: ELEVATED (154.74) | FRONT-MONTH VIX FUTURES: 16.82
Key findings
- The index was still because its parts cancelled. The S&P 500 closed 7,805.45, down 0.02%; biotech fell 3.04%, energy rose 1.80%.
- One row of the week’s range has broken. Energy has travelled 130% of its priced move, the index 7%.
- Premium went back into the front. VIX1D rose 38.86% to 10.72, and Friday’s expiry gained 4.2 points beyond time decay, with inflation data today.
- Widest earnings premiums against own history: Novartis and Novo Nordisk at 1.6x, Apple 0.3x.
Headline driver
Three unrelated things happened at once and cancelled. Chipmakers fell for a sixth straight session, the memory index down 3.44%, with Chinese memory competition cited. Johnson & Johnson dropped about 5.3% on a talc charge and a medical-device miss, dragging pharmaceuticals 2.98% and healthcare 1.35% lower. Against that, renewed attacks on Saudi energy infrastructure lifted oil, and energy rose 1.80%, exploration 2.85%.
None of those drivers has anything to do with the others, which is why the S&P 500 absorbed all of them to finish 0.02% lower. The equal-weighted index rose 0.05%, so this was not a couple of heavy weights holding the tape up.
In our view the day reads as three idiosyncratic moves rather than one rotation, and that distinction is what the correlation measures below describe. Options carry a high risk of rapid loss and are not suitable for every investor.
Market snapshot
Levels are as of the 06:00 CET snapshot on 14 October 2026. US and European figures are the Tuesday 13 October close; Asian figures are Wednesday’s session in progress.
- US (Tuesday 13 October close): S&P 500 7,805.45, down 0.02%. Nasdaq 100 30,569.48, down 0.31%. Dow 51,675.16, down 0.35%. The equal-weighted S&P rose 0.05%. The sector spread beneath ran from biotech down 3.04% to oil and gas exploration up 2.85%. Meta gained 2.63% and Microsoft closed at a record.
- Europe (Tuesday 13 October close): Euro Stoxx 50 down 0.55%, DAX down 0.07%, Stoxx Europe 600 down 0.10% after erasing a gain of as much as 0.7% in a late technology selloff, ASML down 4.2% before its report.
- Asia (Wednesday session): the Kospi has recovered 1.40% to 6,119.67, back above the level it broke Tuesday. Hang Seng Tech is up 1.63%, the Hang Seng 0.16%, CSI 300 down 0.31%.
- Commodities and rates: crude trades at 94.81 and Brent 106.41, both on rolled contracts, so no session comparison is drawn. The gold fund eased 0.13%, silver 1.58% and gold miners 1.45%. Treasury yields rose: the 10-year 5.206% and the 2-year 4.785%, up about 1.4 and 1.7 basis points, derived from the previous export because the change column does not reconcile.
- Market regime: Low Vol Bull. VIX 15.27, 20-day realised volatility 9.25% and stable, the index 1.27% above its 50-day average.
Past performance is not indicative of future results. Source: Saxo, Bloomberg, CBOE.
Volatility surface
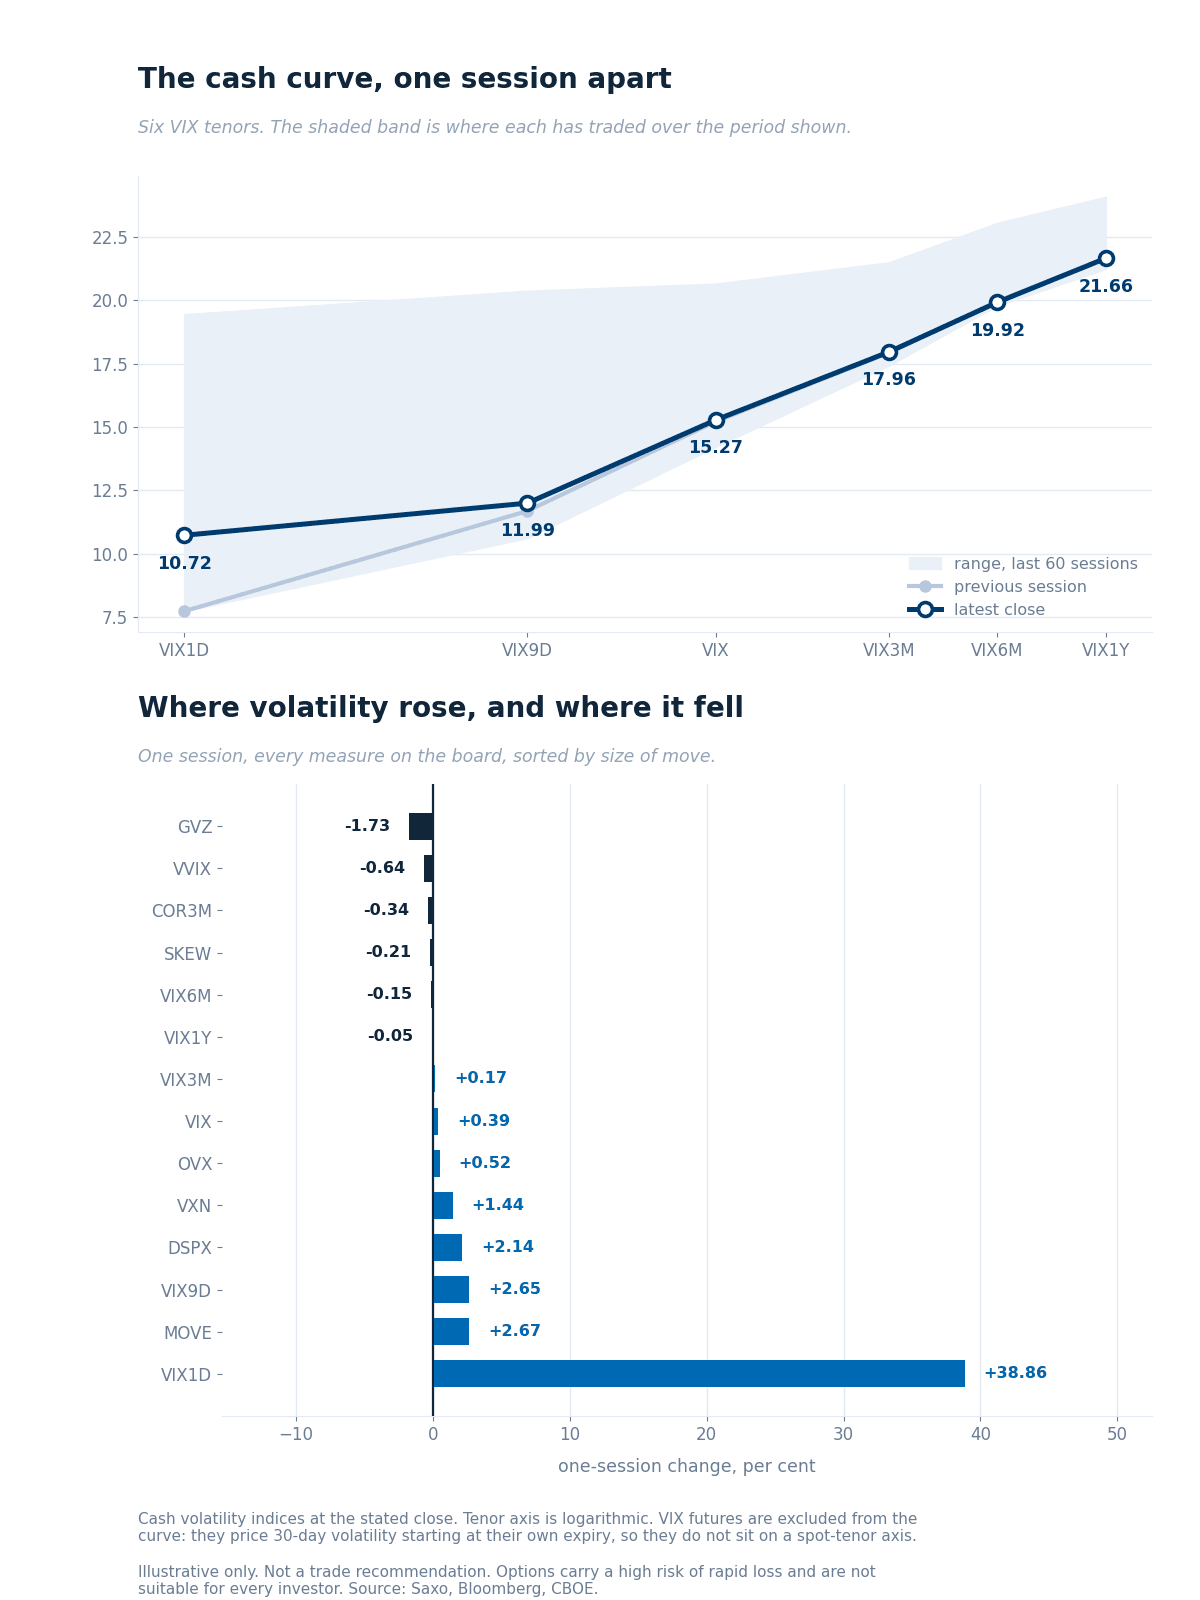
The cash curve against the previous session, over the range each tenor has traded in the last 60 sessions, with the one-session change across every measure on the board. The rates measure spans Friday to Tuesday, because the US cash Treasury market was shut on Monday. Source: Saxo, Bloomberg, CBOE.
The front of the curve did the moving, and only its very front. VIX1D rose 38.86% to 10.72 while the nine-day measure added 0.31 to 11.99, the 30-day 0.06 to 15.27, and everything from three months out barely moved. A one-day measure jumping that far while the nine-day sits still is the board pricing one specific session rather than changing its view: inflation data lands this afternoon.
Ratios. VIX3M/VIX at 1.18 keeps the curve in contango. VXN/VIX at 1.38 is a touch above 1.37, so the Nasdaq premium widened slightly even as the index held.
VIX futures. The 21 October option expiry gives a parity forward of 16.82, consistent to 0.01 across the five strikes nearest the money, a premium to spot of 1.55 points. The feed’s continuous front-month series reads 17.48 and does not reconcile against its stored prior level, so the series has rolled and no session comparison is drawn from it.
Rates. The bond volatility measure is back above 100 at 101.10, its first session since the holiday, which is the one part of the board that is not quiet.
Single-name volatility
Saxo’s one-year implied-volatility ranks, read at Tuesday’s close across 187 US names, describe the same thing the index did: a flat middle and two busy ends.
- The median barely moved and the distribution pulled apart. The median rank was 42.7 against 43.1 a session earlier, on exactly the same 187 names, so the comparison needs no caveat. Underneath it, names above rank 70 grew from 9.1% to 11.8% of the set and names below 20 from 17.6% to 19.3%, while the 40 to 60 middle thinned from 35.3% to 31.6%.
- The two ends are the two sectors that moved. Health care holds seven of the twenty highest ranks and energy two, with Marathon Petroleum at 97.8 and Valero at 95.7, both after single-session rank jumps of 13.8 and 8.1. Merck sits at the top of the list at 100.
- The banks that reported gave back the most. UnitedHealth fell 21.4 rank points, Wells Fargo 17.0 and Johnson & Johnson 13.9, which is event premium leaving after the fact rather than a view changing.
Past performance is not indicative of future results. Source: Saxo.
Options flow sentiment
Based on end-of-day 13 October - yesterday’s positioning, not today’s price action.
- Single-name flow did not lean one way: upside was paid for in semiconductors and crypto-related names while financials, metals and biotech were net sellers of premium.
- Sector and ETF flow was dominated by long-dated structure and mid-market crosses, with the largest index line a sale of upside rather than a directional bet.
Worth stating plainly: the flow does not evidence the dispersion the price action shows. The sectors that moved hardest produced the thinnest tapes, and what traded in them was premium collection. Treat it as neutral.
Where the week's range sits
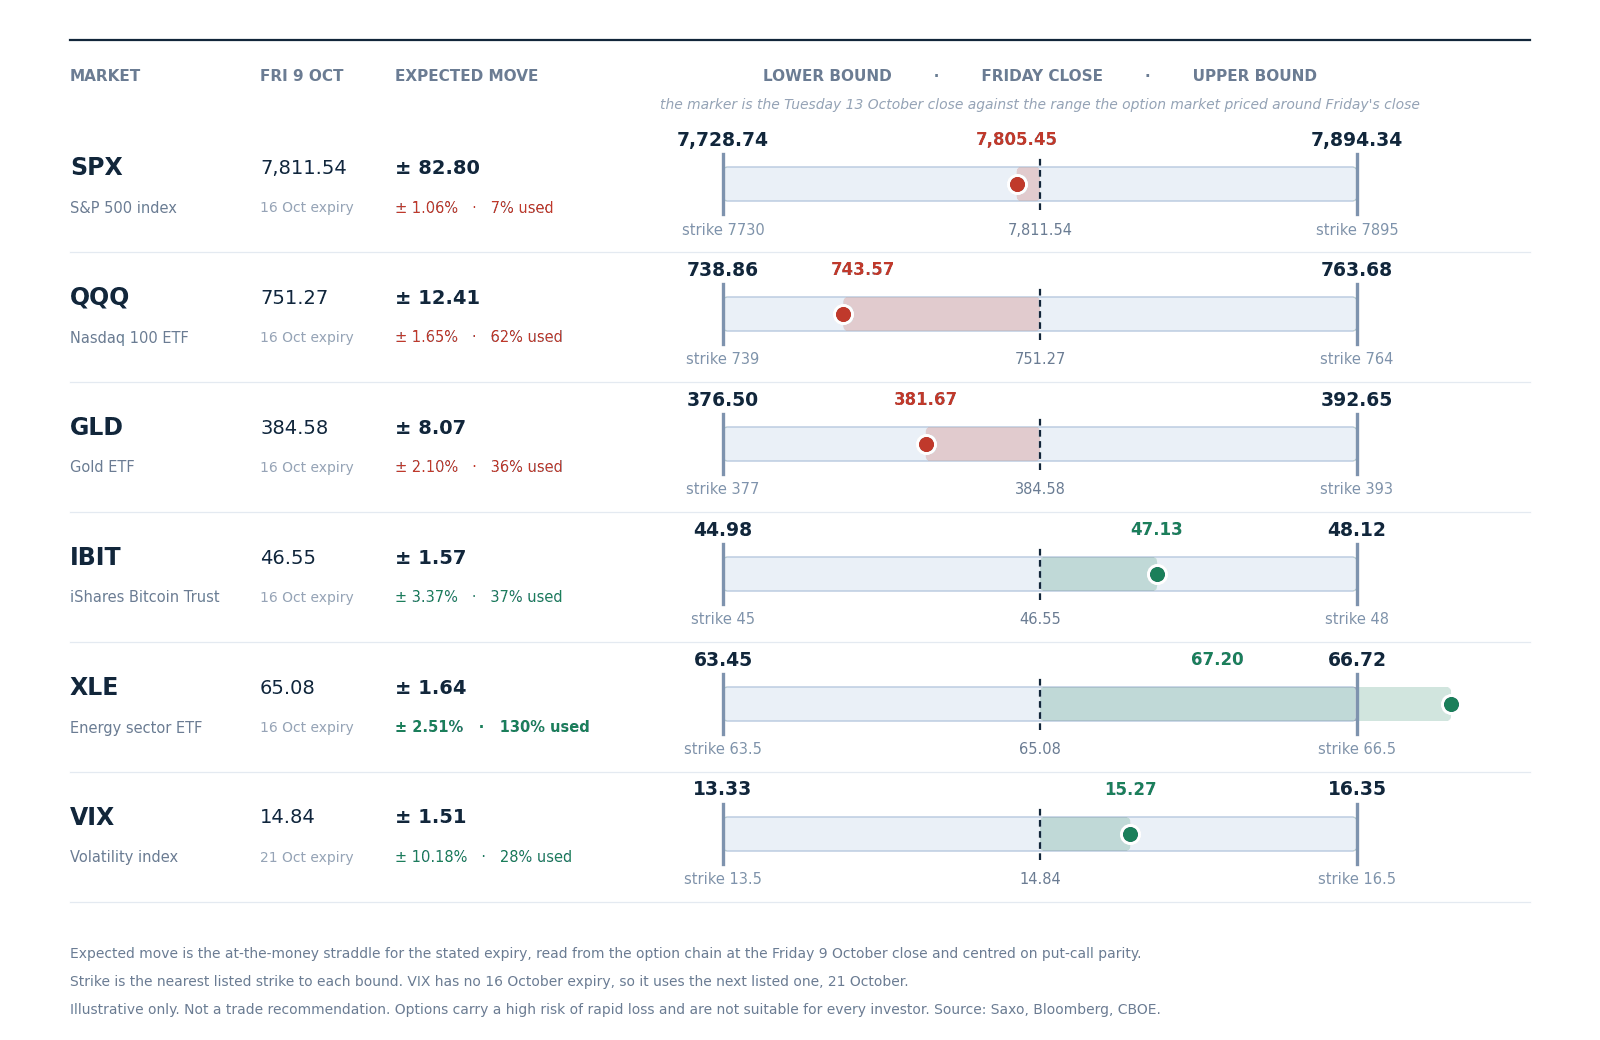
The range the option market priced for this week around Friday 9 October’s close, with the nearest listed strike at each bound and the Tuesday 13 October close as the marker. Figures are at-the-money straddles read from the Saxo chain at Friday’s close and centred on put-call parity. Illustrative only, not a trade recommendation. Source: Saxo, Bloomberg, CBOE.
Two sessions in, the six rows disagree more than they have all month. Energy has travelled 130% of its 1.64-point range and sits above the upper bound, with two sessions still to run. The S&P 500 has used 7% of its 82.80-point range.
That gap is the week in one line. The Nasdaq 100 fund has used 62% of its range, gold 36%, bitcoin’s fund 37% and the VIX 28%. A market whose index has spent a fourteenth of its budget while one of its sectors has spent all of it is not a quiet market; it is a market whose parts are moving against each other.
Options carry a high risk of rapid loss and are not suitable for every investor. Costs and charges apply and vary by account and venue; check the rates applicable to you before entering any position.
Today's catalysts
- September consumer price data at 14:30 CET, the session’s event. Headline inflation is expected at 3.6% against 3.4%, core at 2.5% against 2.4%, with the monthly headline rate seen at 0.6%.
- Earnings before the US open: ASML, Bank of America, Morgan Stanley, BlackRock and Fastenal. Bank of America fell after hours on fines announced by US regulators.
- Also today: the monthly oil market report at 10:00 CET and the Fed’s Beige Book at 20:00 CET.
- The rest of the week: producer prices, retail sales and TSMC tomorrow, and the Fed chair on Friday.
Earnings scorecard
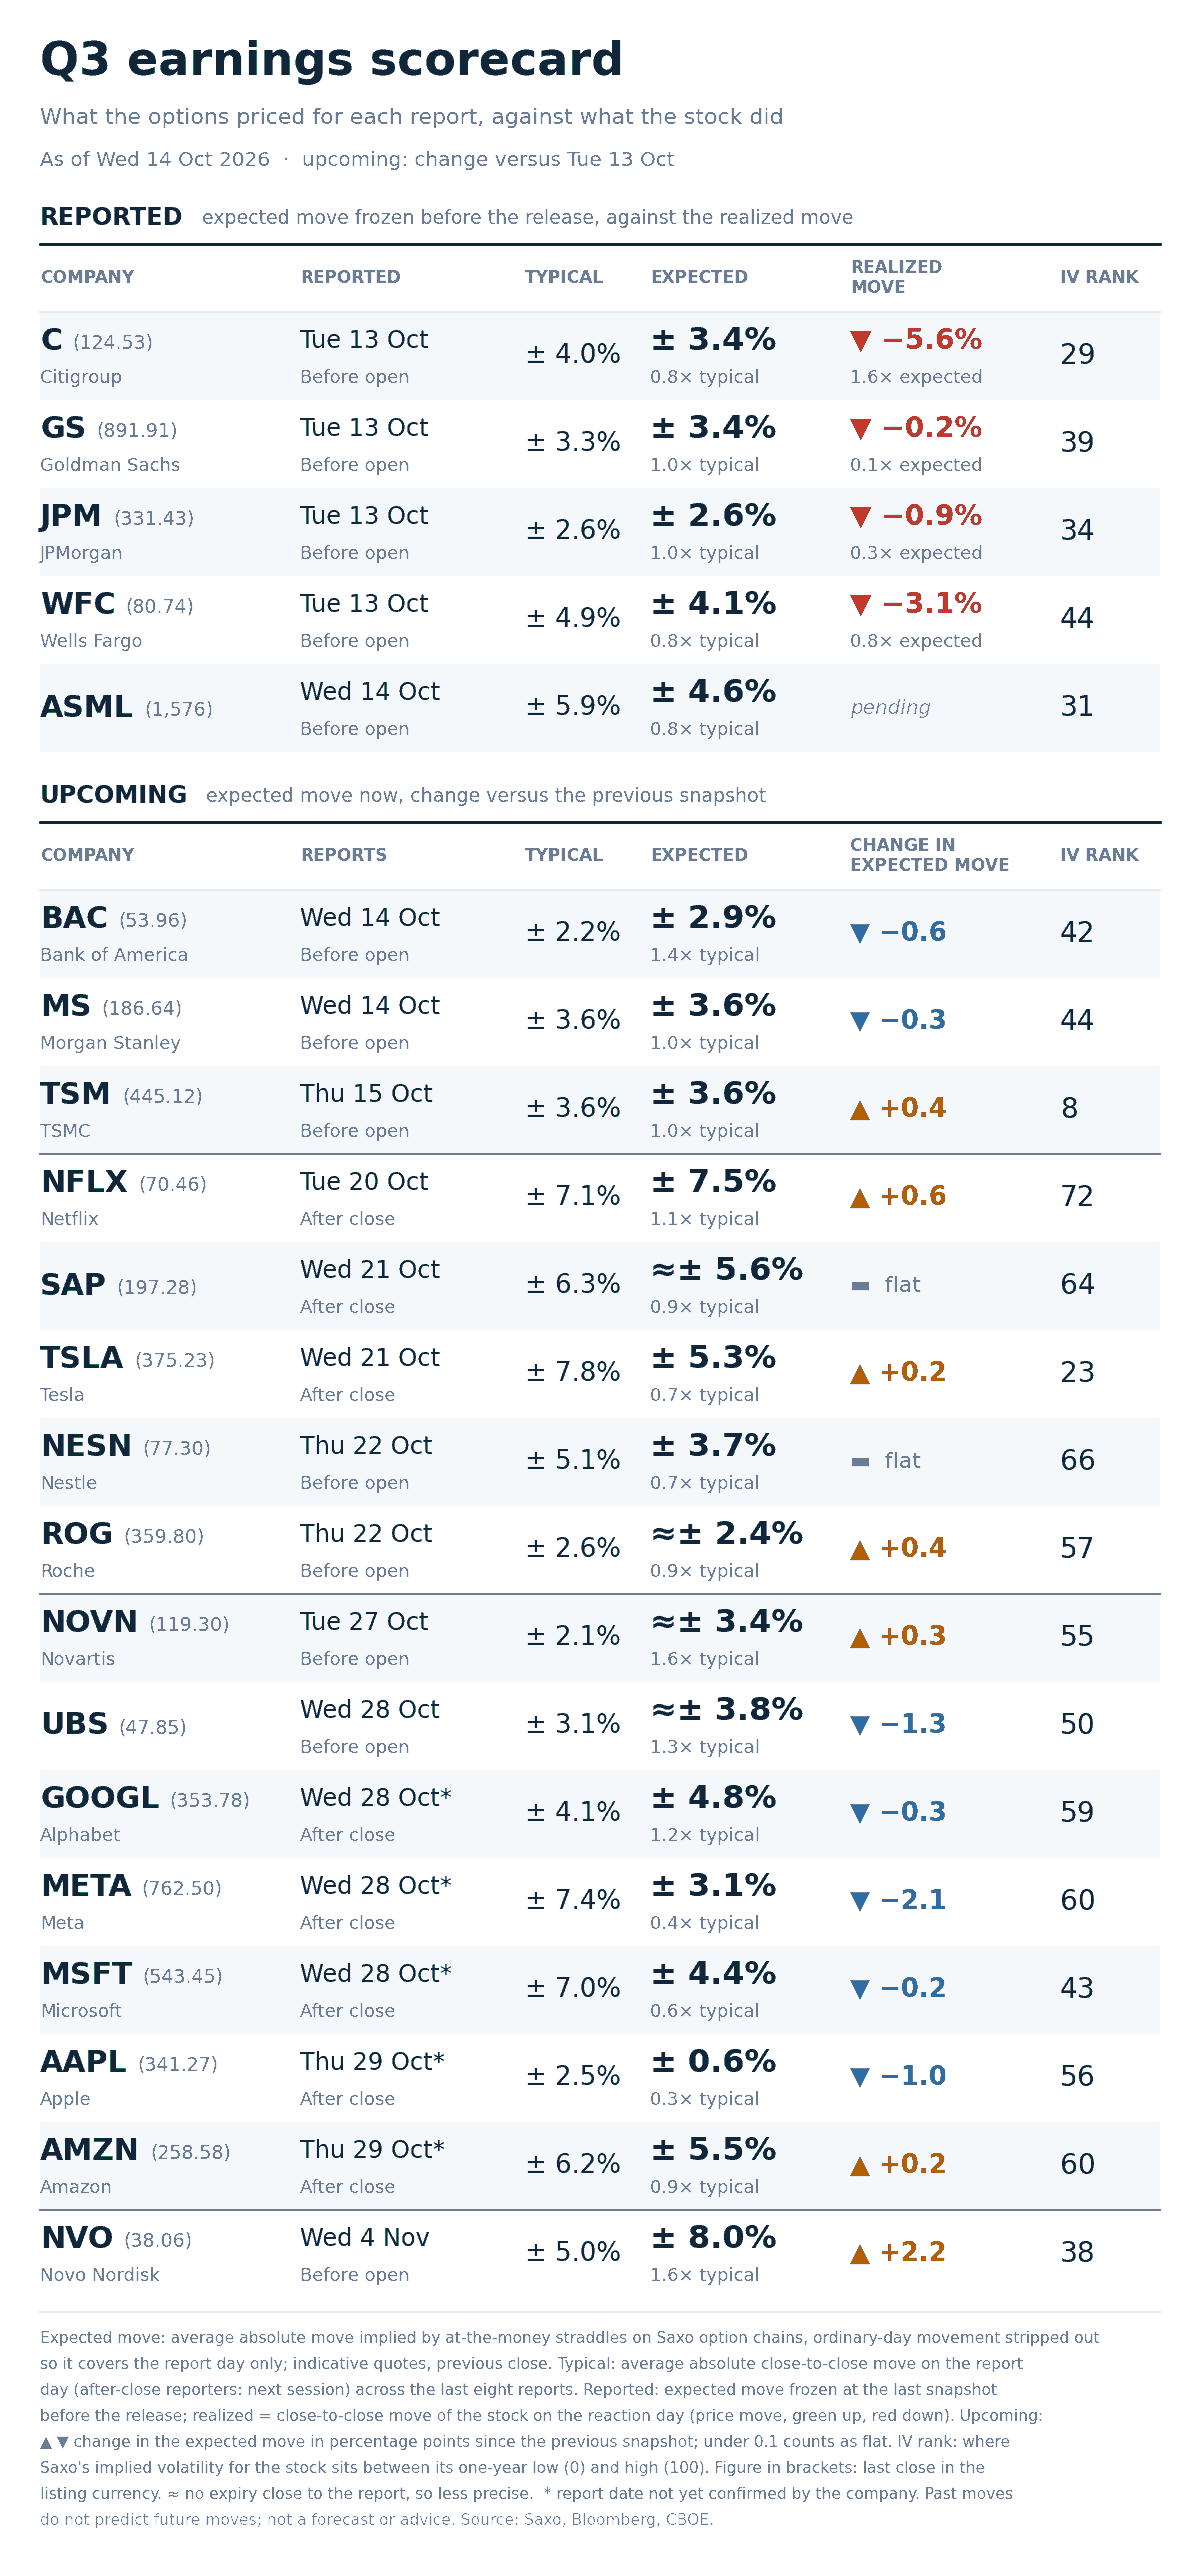
Option-implied expected move for each report day against the average move after the last eight reports, with implied-volatility rank and last close, as of 14 October 2026. Illustrative only, not a trade recommendation. Source: Saxo, Bloomberg, CBOE.
- The banks mostly did less than was priced. Of the four reporting Tuesday, only Citigroup exceeded its expected move, falling 5.6% against 3.4%. Goldman Sachs moved 0.2%, JPMorgan 0.9%, Wells Fargo 3.1%, all inside.
- The widest premiums against own history sit in European healthcare. Novartis prices 3.4% against a 2.1% average, Novo Nordisk 8.0% against 5.0%, both 1.6x. At the other end Apple prices 0.6% against 2.5%, Meta 3.1% against 7.4%.
- Rank and event premium answer different questions. TSMC’s implied-volatility rank is 8, near the bottom of its year, yet Thursday’s report prices 3.6%, exactly its eight-report average. Rank measures the level against the name’s own past; the expected move, what one day costs.
- Of the three reporting this morning, Bank of America prices the widest premium at 2.9% against 2.2%, ASML 4.6% against a typical 5.9%, Morgan Stanley in line at 3.6%.
Options carry a high risk of rapid loss and are not suitable for every investor. Costs and charges apply and vary by account and venue; check the rates applicable to you before entering any position.
What the market is pricing
- Session implied range: today’s expiry prices 39.7 index points, or 0.51%, centred on a parity forward of 7,809.25. Yesterday’s equivalent was 27.0 points on an empty calendar.
- Event implied range: Friday’s expiry prices 65.3 points, or 0.84%. A session earlier the same expiry priced 70.6 points with one more session to run, where decay alone would have left about 61.1. Roughly 4.2 points went in beyond what the clock explains, so implied volatility for this expiry rose into the inflation print.
- Tail risk signal: SKEW at 154.74 is essentially unchanged and still elevated, so the cost of far downside protection did not move while the sectors did.
- Correlation read: three-month implied correlation at 11.71 remains very low and dispersion rose 2.14% to 36.77. That pair is what allows a three percent fall in biotech and a two percent rise in energy to net out to a flat index.
In our view the question is whether this afternoon’s inflation number makes the components agree again. Correlation this low is what has been paying for the calm, and a single number every sector must respond to is the most direct way for that to change.
Options carry a high risk of rapid loss and are not suitable for every investor. Costs and charges apply and vary by account and venue; check the rates applicable to you before entering any position. Past performance is not indicative of future results.
This material is produced for informational and educational purposes only and does not constitute investment advice or a recommendation to buy or sell any instrument. Options involve significant risk and are not suitable for all investors. Figures quoted are derived from option-implied pricing at the stated snapshot times and may change rapidly.
| More from the author |
|---|