
You can access both of our platforms from a single Saxo account.

Paying for the index, not the names - Options Brief - 26 October 2026

Summary: Implied correlation closed at its highest since June while dispersion sat on its median. The option market has decided this week moves as one block, and it has four sessions to be proved right.
Almost every gauge on the volatility board is high against its own three months, and the one sitting at a fresh high is the one that prices the index moving as a block.
MARKET REGIME: NEUTRAL / CHOP | VIX 19.45 | TERM STRUCTURE: CONTANGO | SKEW: ELEVATED (151.80) | FRONT-MONTH VIX FUTURES: 19.450
Today in brief
The short version. Implied correlation closed Friday at 15.00, above every reading in our store back to mid-June, while dispersion sat at 36.93, its median. Those two move against each other by construction, and this is what it looks like when the option market pays for the index rather than for the names inside it. The week ahead explains the bid: a Federal Reserve decision, third-quarter growth, the September inflation deflator and three of the index’s largest companies, all in four sessions.
Markets. The S&P 500 closed at 7,623.68, down 0.52%, and the Dow lost 1.24% while the Nasdaq 100 finished unchanged at 28,957.53. The equal-weighted index fell 0.78%, so a narrow group held the cap-weighted version up. Energy rose 2.60% and technology 0.49%; communication services, consumer discretionary, financials and industrials all fell more than a per cent. Oil carried the session, Brent settling at 116.72 on Gulf supply risk before reversing to near 114 this morning. The ten-year Treasury yield closed at 4.999% and has eased since.
Volatility curve. The cash curve held its contango, the one-day gauge gaining 10.74% to 16.81 against a flat nine-day at 18.70 and a one-year at 22.82. Oil volatility made the largest single move, up 7.87% to 60.02. The bond gauge fell 3.30% to 103.32 and vol-of-vol rose to 109.70, within a quarter of a point of its highest reading in the store.
Single names. Almost nothing happened. On an identical 524 underlyings the median implied-volatility rank moved to 47.7 from 47.1. What movement there was sat in names with events attached, not in the population.
Flow. Friday’s ten reports gave no readable direction. The one line with a clear side was index put protection bought ahead of this week.
This week’s range. The option market prices 137.05 points, 1.80%, for the S&P 500 into Friday’s expiry, about 15% wider than the band priced a week ago. The week has not opened, so none of it has been used.
Earnings and catalysts. The spread between what is priced and what each name has done runs from 1.5x at Novartis to 0.4x at Apple. Today brings the German IFO survey and two second-tier US activity readings. The Federal Reserve, the Reserve Bank of New Zealand and the Bank of Canada all decide on Wednesday, the European Central Bank on Thursday and the Bank of Japan on Friday.
What it adds up to. Today’s expiry prices 0.78% and Friday’s 1.78%. Friday’s is the one that matters: the first contract in three weeks whose window contains a Federal Reserve decision. In our view the correlation reading may say more about how the market expects that week to be paid for than the level of the VIX does.
That is the whole brief in one read. The sections below hold the detail behind each paragraph, with the charts, the full set of readings and the sources, for when you want to go deeper on one part.
Headline driver
Oil set the tone and the Federal Reserve set the clock. Attacks on Saudi infrastructure continued through the weekend and Riyadh’s main airport reopened after a two-week shutdown, while the US administration signalled it was close to deciding whether to strike Iran or pursue a deal. Brent settled at 116.72 on Friday, its highest in six months, and the oil volatility gauge rose 7.87% to 60.02.
Equities took the inflation implication rather than the geopolitics. The S&P 500 fell 0.52% and the Dow 1.24%, with ExxonMobil up 2.8% against American Express down 3.7%. The semiconductor index recovered 0.4% after Thursday’s selloff.
By Monday morning the oil move had partly reversed, Brent trading near 114 on hopes of de-escalation. What has not reversed is the calendar: five central banks and three of the index’s largest constituents report inside the next four sessions.
Market snapshot
- US (Friday 23 October close): S&P 500 7,623.68, down 0.52%. Nasdaq 100 28,957.53, unchanged. Dow Jones Industrial Average 52,220.21, down 1.24%. The equal-weighted S&P 500 fell 0.78%. Energy rose 2.60%, software 1.72% and semiconductors 0.74%, while communication services fell 1.78%, consumer discretionary 1.66% and financials 1.32%.
- Europe: the Stoxx 600 eased 0.31% to 635.78, the DAX 0.75% to 25,181.65 and the CAC 40 0.36%. Kering fell 16.6% on weak Gucci sales, Volvo Cars 24.2% and Safran 10%, while L’Oreal rose 5.6%.
- Asia (Monday morning): the Nikkei 225 closed 0.8% lower and the Kospi fell 0.87% to 5,502.17, while the Hang Seng held near flat at 23,193.94 and the CSI 300 eased 0.54%.
- Commodities and rates: Brent settled at 116.72 and WTI near 103, both reversing lower this morning. Gold holds above 4,000 after a weekly fall of more than 4%, its largest since June, with the gold fund down 0.65% on Friday. The ten-year Treasury yield closed at 4.999%, the two-year at 4.69% and the thirty-year at 5.296%, each easing this morning. Bitcoin traded near 79,400 and the largest bitcoin fund closed at 45.96.
- Market regime: neutral and choppy, the VIX at 19.45, the cash curve in contango and SKEW elevated at 151.80.
All figures from the watchlist export taken at 05:00 CET on 26 October 2026, which carries Friday’s US closes. Past performance is not indicative of future results. Source: Saxo, Bloomberg, CBOE.
Volatility surface
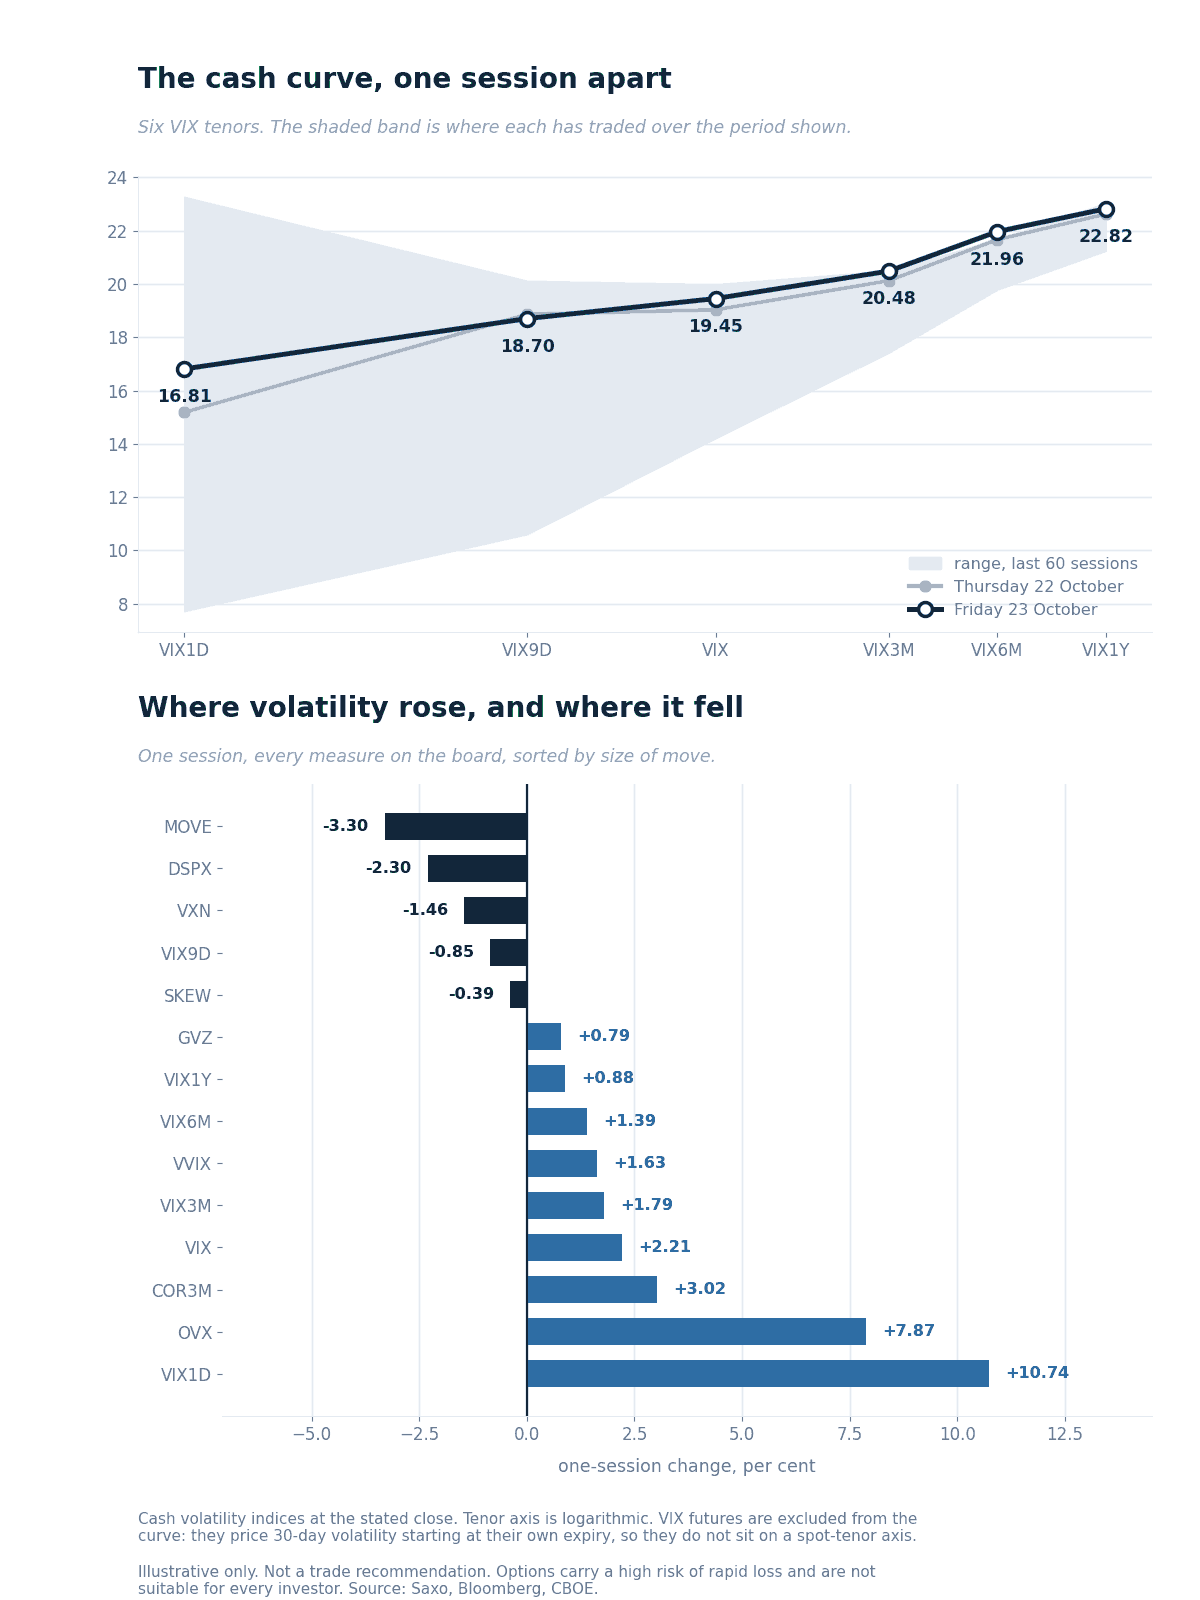
The cash curve against the previous session, over each tenor’s 60-session range, with the one-session change across every measure on the board. Source: Saxo, Bloomberg, CBOE.
The board is high nearly everywhere. Against the 102 sessions we hold back to 15 June, the VIX at 19.45 sits in the top fifth of its range, the Nasdaq gauge at 28.30 and the bond gauge at 103.32 in the top quarter, and vol-of-vol at 109.70 within a quarter-point of its highest reading in the store. The day’s move was narrower: oil volatility rose 7.87% to 60.02 while equity gauges barely shifted.
Ratios. VIX1D/VIX reads 0.86, so a single session is priced close to a month. VIX3M/VIX holds at 1.05, the curve upward sloping. VXN/VIX eased to 1.46 from 1.51.
VIX futures. The front contract is November. It closed Friday at 19.615, a premium of 0.165 to spot, with December beneath it at 19.495, so the first two futures sit in slight backwardation while the cash curve does not. Put-call parity on the 18 November options returned a forward of 19.53 this morning, consistent across the five strikes nearest the money, so the series has not rolled and the comparison holds.
Correlation and tails. Implied correlation rose 3.02% to 15.00, above the 14.56 high set the session before and well clear of the 10.22 median. Dispersion fell 2.30% to 36.93, its median. SKEW eased to 151.80 and gold volatility rose 0.79% to 24.34.
Single-name volatility
The index measures above moved while the names inside them did not. On an identical universe of 524 underlyings, so no part of this is a composition effect, the median implied-volatility rank rose to 47.7 from 47.1. The share of names above rank 50 eased to 45.0% from 45.8% and the share below rank 20 rose to 9.5% from 8.8%. The typical name therefore sits just below the midpoint of its own year, and spent Friday staying there.
Where rank did move, an event explains it in both directions. Kering lost 33.6 points of rank after reporting, the ordinary collapse of event premium once the event has passed, on the same session its shares fell 16.6%. Linde gained 18.5 points into a report due Thursday. That pairing is the week in miniature: rank drains out of the names that have reported and builds in the ones that have not.
A note on what rank measures. A high rank says a name’s implied volatility sits far from the extremes of its own year. It does not say how many days in that year looked like today, which is what a percentile answers, and the two can disagree sharply for a name whose volatility has spent most of the year in a narrow band.
Source: Saxo.
Options flow sentiment
Based on end-of-day 23 October, yesterday’s positioning, not today’s price action.
- Single-name flow gave no readable direction. Across the ten reports the large lines were rolls, paired packages and mid-market prints with no aggressor side, and the premium split is a structural artefact rather than a view.
- Sector and ETF flow was unreadable on the same test, with one exception worth naming: index put protection was bought outright ahead of this week’s decisions and results, which is the only large line in the set with a confirmed side.
Where the week's range sits
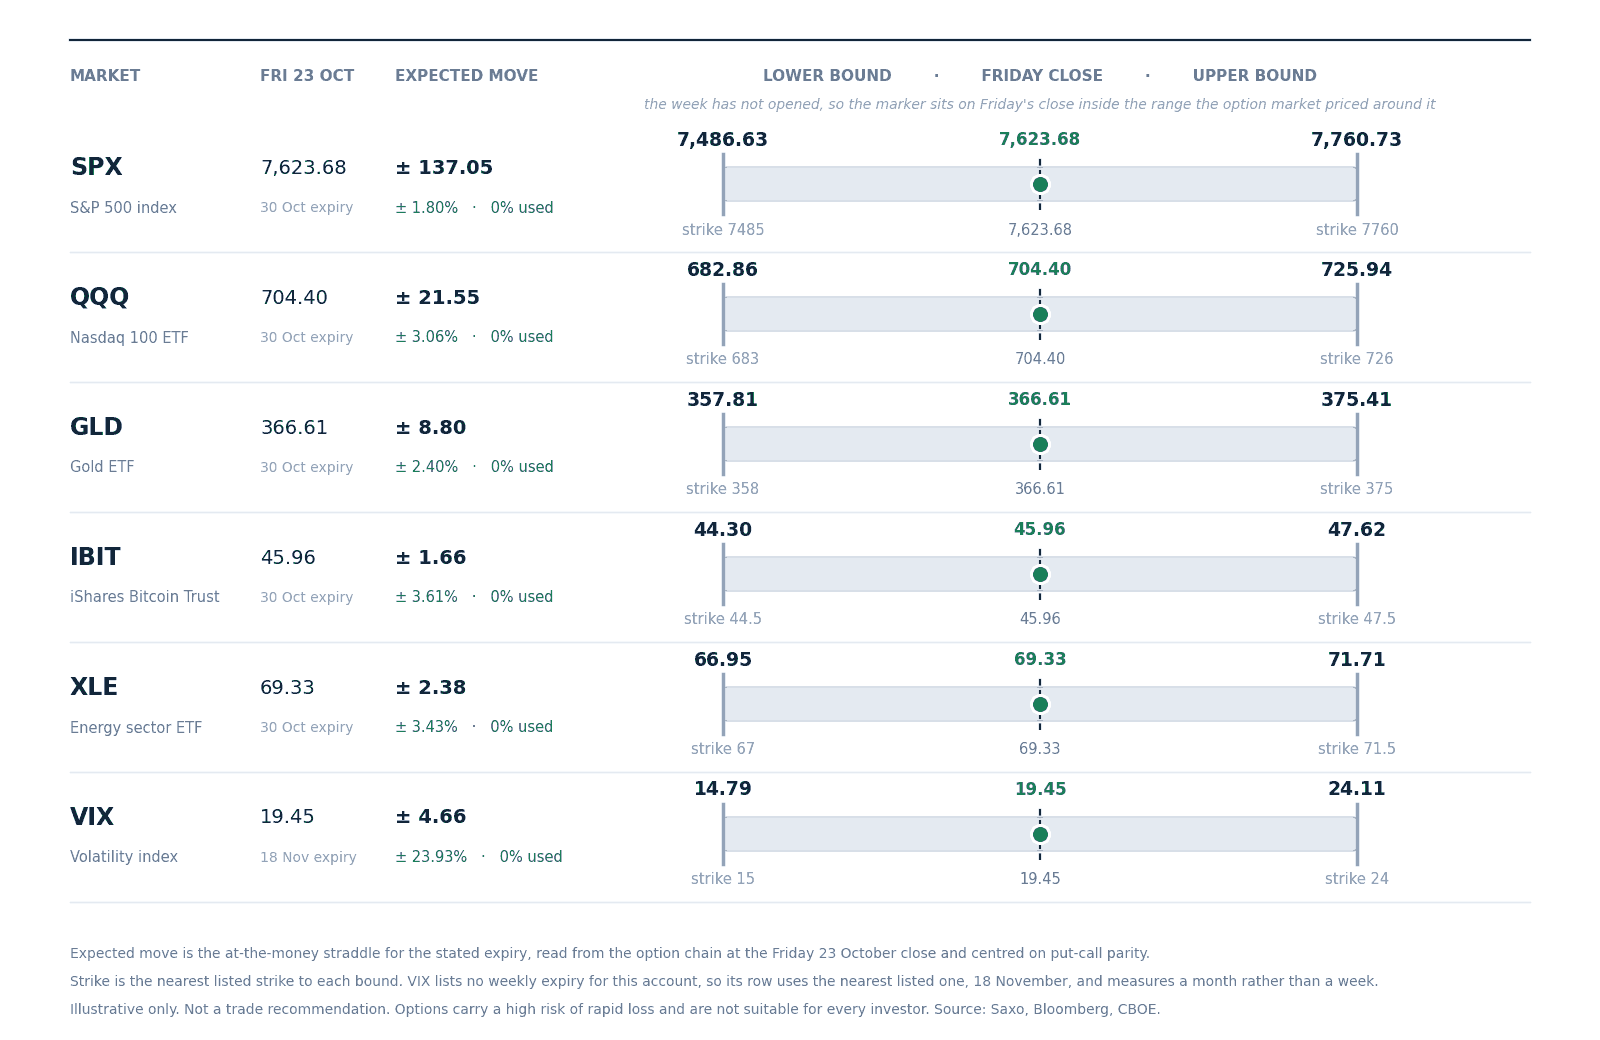
The range the option market priced for this week around Friday 23 October’s close. The week has not opened, so no marker has moved. Straddles are at-the-money, from the Saxo chain, centred on put-call parity. Illustrative only, not a trade recommendation. Past performance is not indicative of future results. Source: Saxo, Bloomberg, CBOE.
The S&P 500 begins with 137.05 points priced around Friday’s close, 1.80%, from 7,486.63 to 7,760.73, nearest strikes 7485 and 7760. That is about 15% wider than a week ago’s 119.13.
The width has an obvious cause: this is the first weekly band in three weeks whose expiry sits after a Federal Reserve decision rather than before one. Last week’s stopped five days short of it. Friday’s pays for the decision, Thursday’s releases and three large results.
The Nasdaq 100 fund is priced for 3.06%, energy 3.43%, gold 2.40% and the bitcoin fund 3.61%. The volatility row uses the nearest listed expiry, 18 November, so it measures a month, not a week.
Options carry a high risk of rapid loss and are not suitable for every investor. Costs and charges apply and vary by account and venue; check the rates applicable to you.
Today's catalysts
- 10:00 CET German October IFO business climate survey.
- 13:30 CET US September Chicago Fed national activity index, before the cash open.
- 15:30 CET US October Dallas Fed manufacturing activity, then a two-year Treasury note auction at 18:00.
- Earnings today: Verizon, Welltower, Cadence Design Systems and Nucor.
One clock note for this week. The US has not yet left summer time while Europe did on Sunday, so the gap is five hours rather than six: the US cash session runs 14:30 to 21:00 CET until 1 November. Wednesday’s Federal Reserve decision at 19:00 CET therefore lands two hours before the close, inside the session, with the press conference at 19:30.
Earnings scorecard
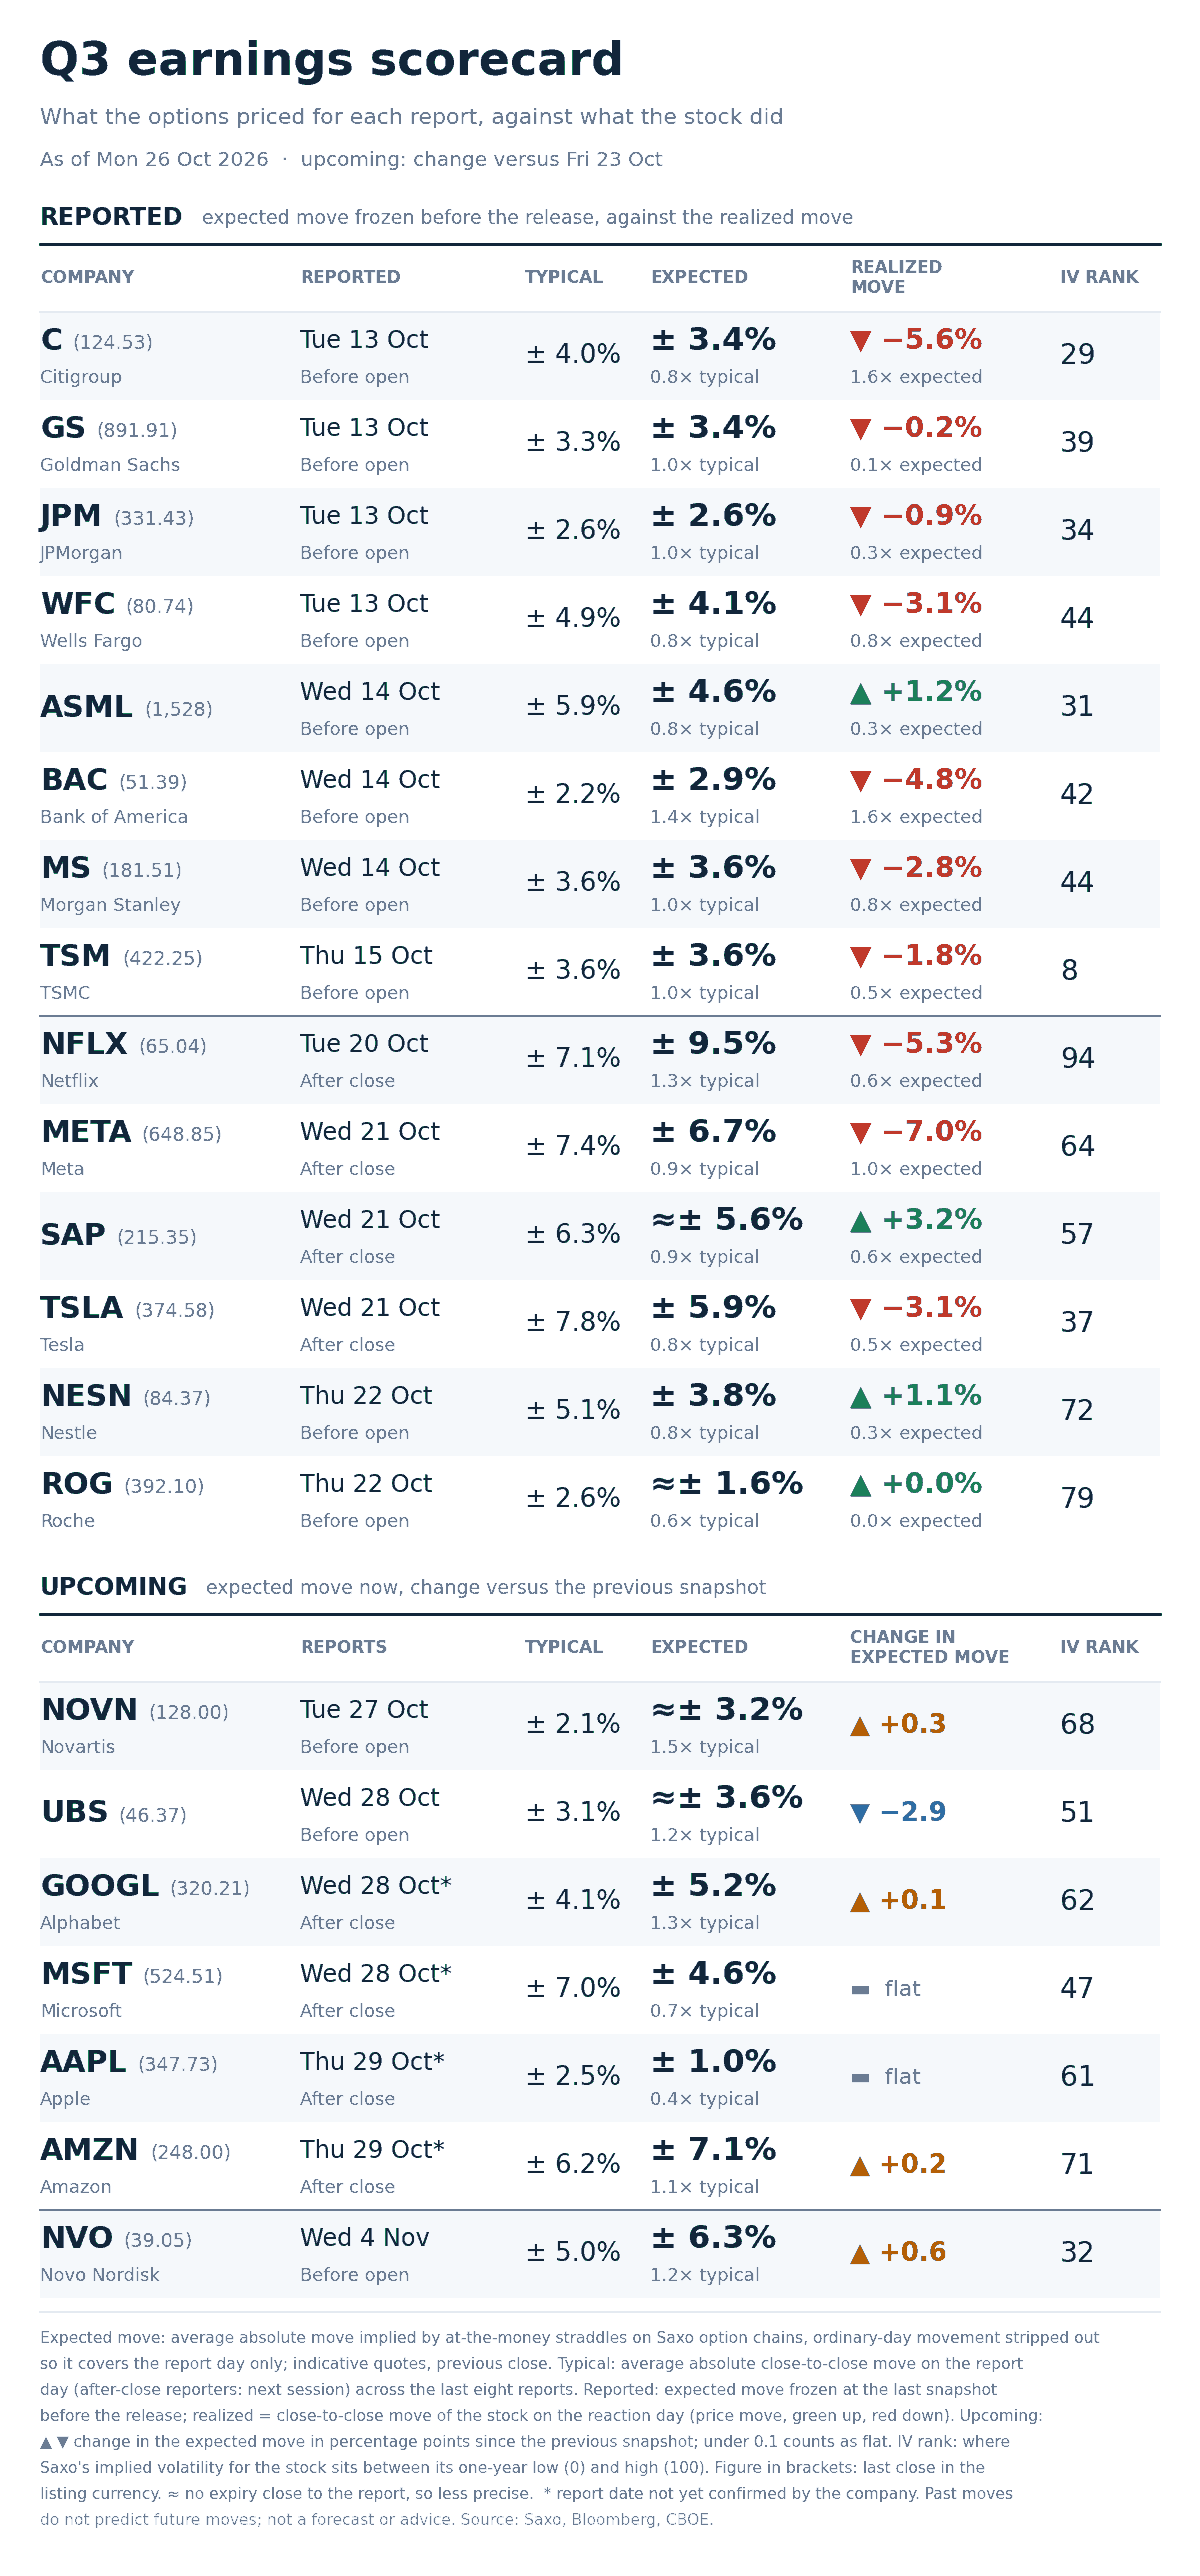
Option-implied expected move for each report day against the stock’s average move after its last eight reports, across the twenty-one names tracked this season. Arrows show whether a move rose or eased since the previous day. Past performance is not indicative of future results. Source: Saxo, Bloomberg, CBOE.
The spread between what is priced and what each name has done runs from 1.5x to 0.4x. Novartis is richest at 3.2% into Tuesday against an eight-report average of 2.1%; Apple cheapest at 1.0% against 2.5%. Alphabet sits at 5.2% against 4.1%, Amazon at 7.1% against 6.2%, and Microsoft at 4.6% against a 7.0% history, the only one of those below what it has typically done.
Rank and the event premium answer different questions, and this board separates them. Amazon carries a rank of 71 and prices 7.1%; Apple sits at 61 and prices 1.0%. Nearly the same position in the year, seven times the move for one day. Rank describes a year; the event premium an afternoon.
Meta is the completed example: priced at 6.7%, it moved 7.0%. Next are Novartis on Tuesday, UBS, Alphabet and Microsoft on Wednesday, Amazon Thursday.
Options carry a high risk of rapid loss and are not suitable for every investor. Costs and charges apply and vary by account and venue; check the rates applicable to you.
What the market is pricing
- Session implied range: SPX options price 59 points, 0.78%, for today’s expiry, derived from the at-the-money straddle on the Saxo chain and centred on put-call parity. No recent edition quoted this contract, so there is no like-for-like comparison to draw.
- Event implied range: the 30 October expiry prices 136 points, 1.78%, covering Wednesday’s Federal Reserve decision, Thursday’s growth and inflation releases and three large results. Read from the same chain and method at Friday’s close, the same contract was 137.05. Five sessions remained then and five remain now, so decay accounts for none of the difference and a little volatility has come out of the week.
- Correlation read: implied correlation at 15.00 is above every reading in our store back to 15 June, while dispersion at 36.93 sits on its median. In our view the market may be paying for the index to move as one rather than for the names to separate, which is the shape a macro week tends to take.
- Tail risk signal: SKEW at 151.80 sits above its 144.69 median with the VIX in the top fifth of its own range. Both can be read as the cost of carrying the week rather than a view on its direction.
In our view the useful contrast this morning may be between a volatility board that is broadly elevated and a single-name surface that is not. The index is where the week is being priced, and the names inside it have largely been left alone. Options carry a high risk of rapid loss and are not suitable for every investor. Costs and charges apply and vary by account and venue; check the rates applicable to you. Past performance is not indicative of future results.
| More from the author |
|---|