
Un seul compte Saxo suffit pour accéder à nos plateformes.

Yields spiked, equity vol stayed cheap - Options Brief - 24 September 2026
Options 10 minutes to read

Résumé: The US ten-year yield closed above 5.11% for the first time since 2007, and the volatility that came with it went almost entirely into bonds. Equity index volatility barely moved. One of those two is mispriced.
The ten-year Treasury yield closed above 5.11% on Wednesday, the highest since 2007. The volatility that came with it landed in bonds.
MARKET REGIME: LOW VOL BULL | VIX 15.18 | TERM STRUCTURE: CONTANGO | SKEW: ELEVATED (146.15) | FRONT-MONTH VIX FUTURES: 17.80
- Bond volatility made a three-month high. MOVE rose 21.50% to 95.45, above all 59 prior sessions.
- Equity index volatility did not follow. The VIX rose 6.83% to 15.18, exceeded on 43 of those 59.
- The repricing was concentrated. The rates and credit median rank more than doubled to 48.8 from 23.7; the index group sits at 17.1.
Headline driver
US business activity expanded at its fastest pace in more than five years. The flash composite purchasing managers’ index rose to 58.4 in September, with services at 58.7 and manufacturing jumping to 57.0 from 53.9, the strongest manufacturing reading since May 2022. Bond markets read it as a reason to price less policy easing and more tightening risk.
The response landed in the curve rather than in the index. The benchmark ten-year yield closed fifteen basis points higher, above 5.11%, and five-year and longer maturities all set new post-crisis highs. A five-year note auction drew the weakest bidding since late 2018, and the two-year closed at 4.891%.
Europe moved with it. The German ten-year yield rose nine basis points to above 3.555%, and the Germany to France ten-year spread widened past 110 basis points, the widest since 2012.
Market snapshot
- US (Wednesday 23 September close): The S&P 500 fell 0.75% to 7,706.03, the Nasdaq 100 0.85% to 30,470.29 and the Dow 0.68% to 51,517.16. The Russell 2000 dropped 1.77%, the weakest of the majors. Energy was the only sector to close higher, the XLE fund up 0.96%. Rate-sensitive corners took the brunt: the XBI biotechnology fund fell 4.12%, the GDX gold miners fund 4.36%, utilities 1.92% and real estate 1.55%. Alphabet lost 3.80% to 337.83 while Meta Platforms rose 1.02% to 744.10.
- Europe: The Stoxx Europe 600 fell 0.44% to 639.93 and the DAX 0.66% to 25,410.63, with insurance and autos the weakest sectors, a pattern consistent with the move in yields.
- Asia (Thursday session, in progress): Japan’s Nikkei 225 is 1.01% higher at 65,674.51 after the Silver Week break, the Hang Seng 0.52% lower and the CSI 300 1.29% lower. The Kospi closed Wednesday 0.90% higher at 7,080.92.
- Commodities and rates: Brent settled near USD 103 a barrel, ending a five-session slide, and WTI trades near USD 91.46. Spot gold slipped below USD 4,300 and silver fell about 4%. The US ten-year yield closed above 5.11% and the two-year at 4.891%.
- Market regime: Low Vol Bull, with the VIX at 15.18, the cash curve in contango and twenty-day realised volatility at 10.71%.
Source: Saxo, Bloomberg, CBOE. Levels as of the 23 September close unless stated. Past performance is not indicative of future results.
Volatility surface - 24 September 2026, approx. 06:00 CET
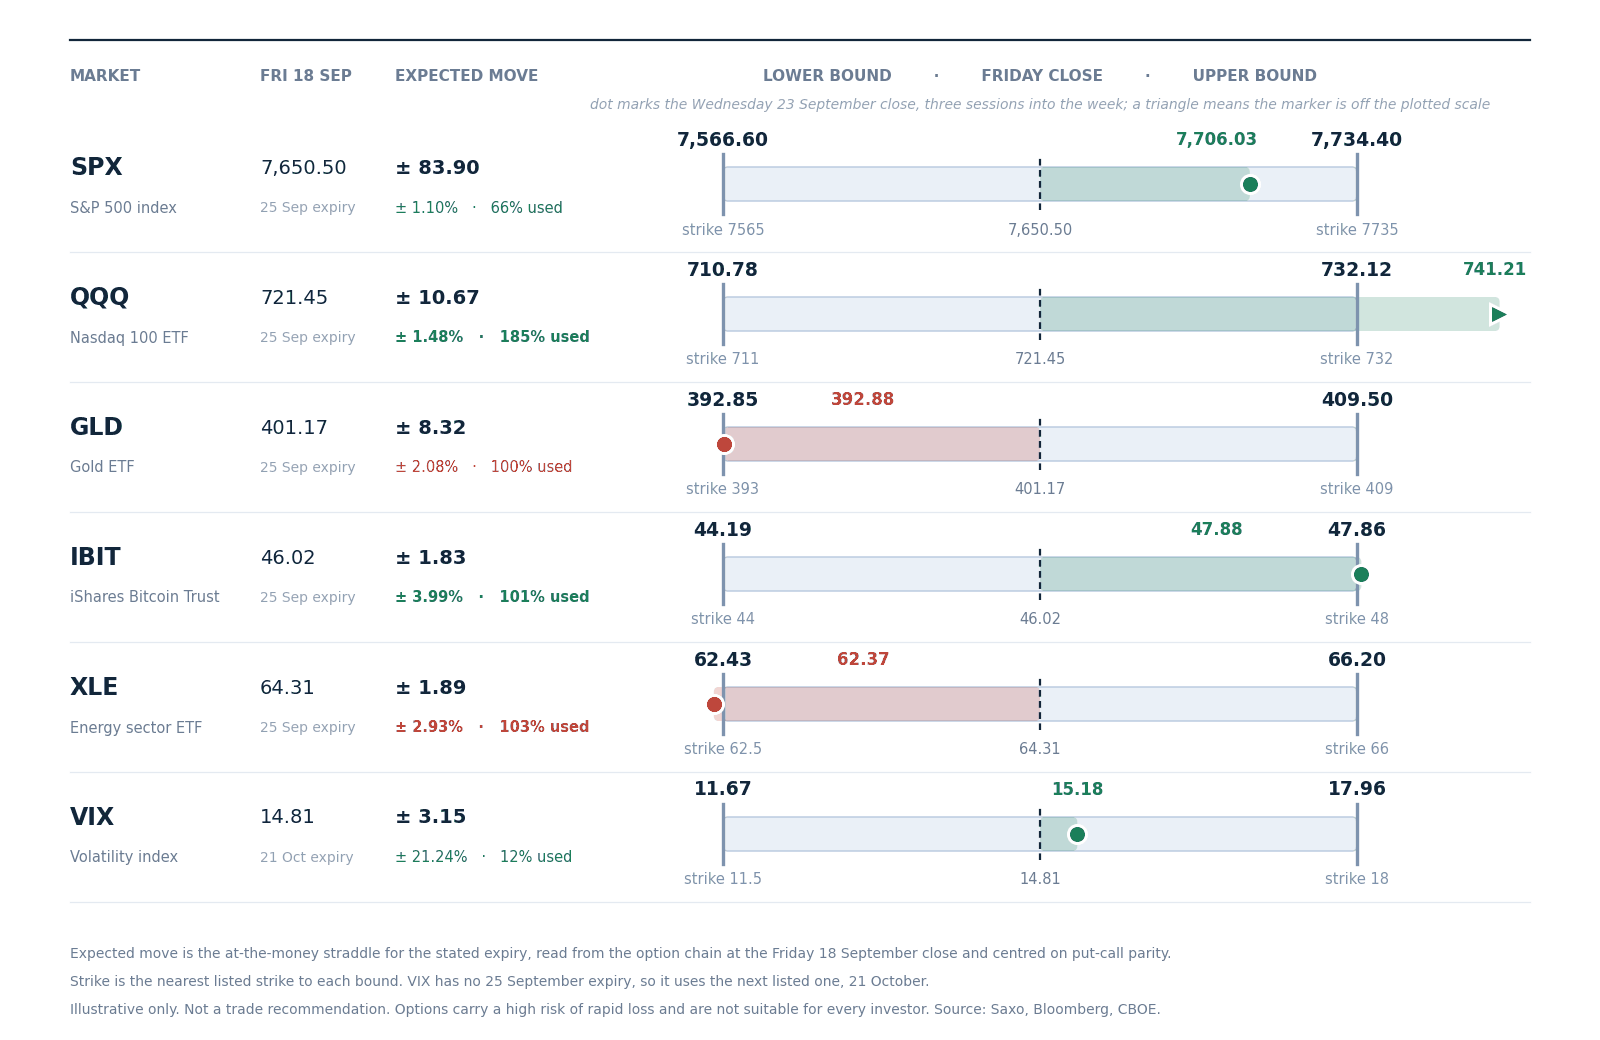 The six cash VIX tenors at Wednesday’s close against the previous session and the 60-session range of each, with every measure’s one-session change below.
Reading the curve
- Every tenor rose, and the front rose hardest. VIX1D gained 21.29% to 10.71 and VIX9D 10.88% to 13.45, against 0.46% at the one-year point. The curve lifted off the floor of its 60-session band and flattened while doing it.
- The move that matters is not on this curve. MOVE, the Treasury measure, rose 21.50% to 95.45, above all 59 prior sessions in the store, whose range ran 68.16 to 83.90. Long-bond implied volatility rose 12.11%.
- Ratios, which the graphic does not carry. VIX3M to VIX eased to 1.19 from 1.24, and VXN to VIX to 1.37 from 1.42, with 48 of the previous 59 wider.
VIX futures
- Front-month 17.80, the October contract, confirmed by put-call parity at 17.73, so the contract has not rolled. Against a 15.18 cash close that is a premium of roughly 2.62 points, narrowed from 3.14 a session earlier.
- Second-month 18.45, ratio 0.965, contango. Neither sits in the graphic: both price 30-day volatility starting at their own expiry.
Data source: Saxo, Bloomberg, CBOE, as of 24 September 2026, approximately 06:00 CET. Past performance is not indicative of future results.
Single-name volatility - where implied volatility sits against its own year
Saxo’s implied-volatility rank across 186 US and 335 euro-zone option underlyings, where 0 is a one-year low and 100 a one-year high. Both sessions cover the same names.
- The typical name got dearer. The median US rank rose to 37.2 from 31.8 and the median percentile to 46.6 from 37.7.
- The increase was concentrated in anything rate-sensitive. The rates and credit group’s median rank more than doubled to 48.8 from 23.7, and utilities rose to 34.2 from 21.7. The TLT long-bond fund carries a rank of 52.9 against a percentile of 89.3: modest against the year’s extremes, and higher than on roughly nine sessions in ten of the past year. Rank measures distance from the extremes; percentile measures how many days looked like today.
- The index group did not move with it, at a median rank of 17.1, still the lowest on the board, with SPY at 12.0 and the Russell 2000 fund at 14.9. Precious metals fell hardest and got cheaper to hedge, the commodity median easing to 22.1 from 26.3, GLD at 15.7 and SLV at 11.8. In our view that is the day’s argument from the single-name side. See Saxo pricing for costs and charges.
Data source: Saxo, as of 24 September 2026, reflecting the 23 September close. Day counts are Saxo’s one-year implied-volatility percentile. Past performance is not indicative of future results.
Options flow sentiment
Based on end-of-day 23 September, Wednesday’s positioning and not today’s price action.
- Single-name flow gave one clean read and little else. Mega-cap technology showed bought downside part-financed by written upside into the late-October earnings window, which is protection with a cost budget rather than a bearish view on the group. Elsewhere the tape was two-sided and largely crossed at the mid.
- Sector and ETF flow read as maintenance. Index activity concentrated in financing legs and near delta-flat packages, while rates and defensive-sector activity looked like rolls, calendars and long-horizon structure rather than a view on the direction of yields. Named funds are market context only; see Saxo pricing for costs and charges on exchange-traded fund trades.
Worth stating plainly: no confirmed-opening activity survived the filter in the volatility complex or the inverse-equity funds. In our view that absence is consistent with the reading elsewhere in this brief rather than evidence for it.
Where the week’s range sits
What the option market priced for this week, against where Wednesday left it.
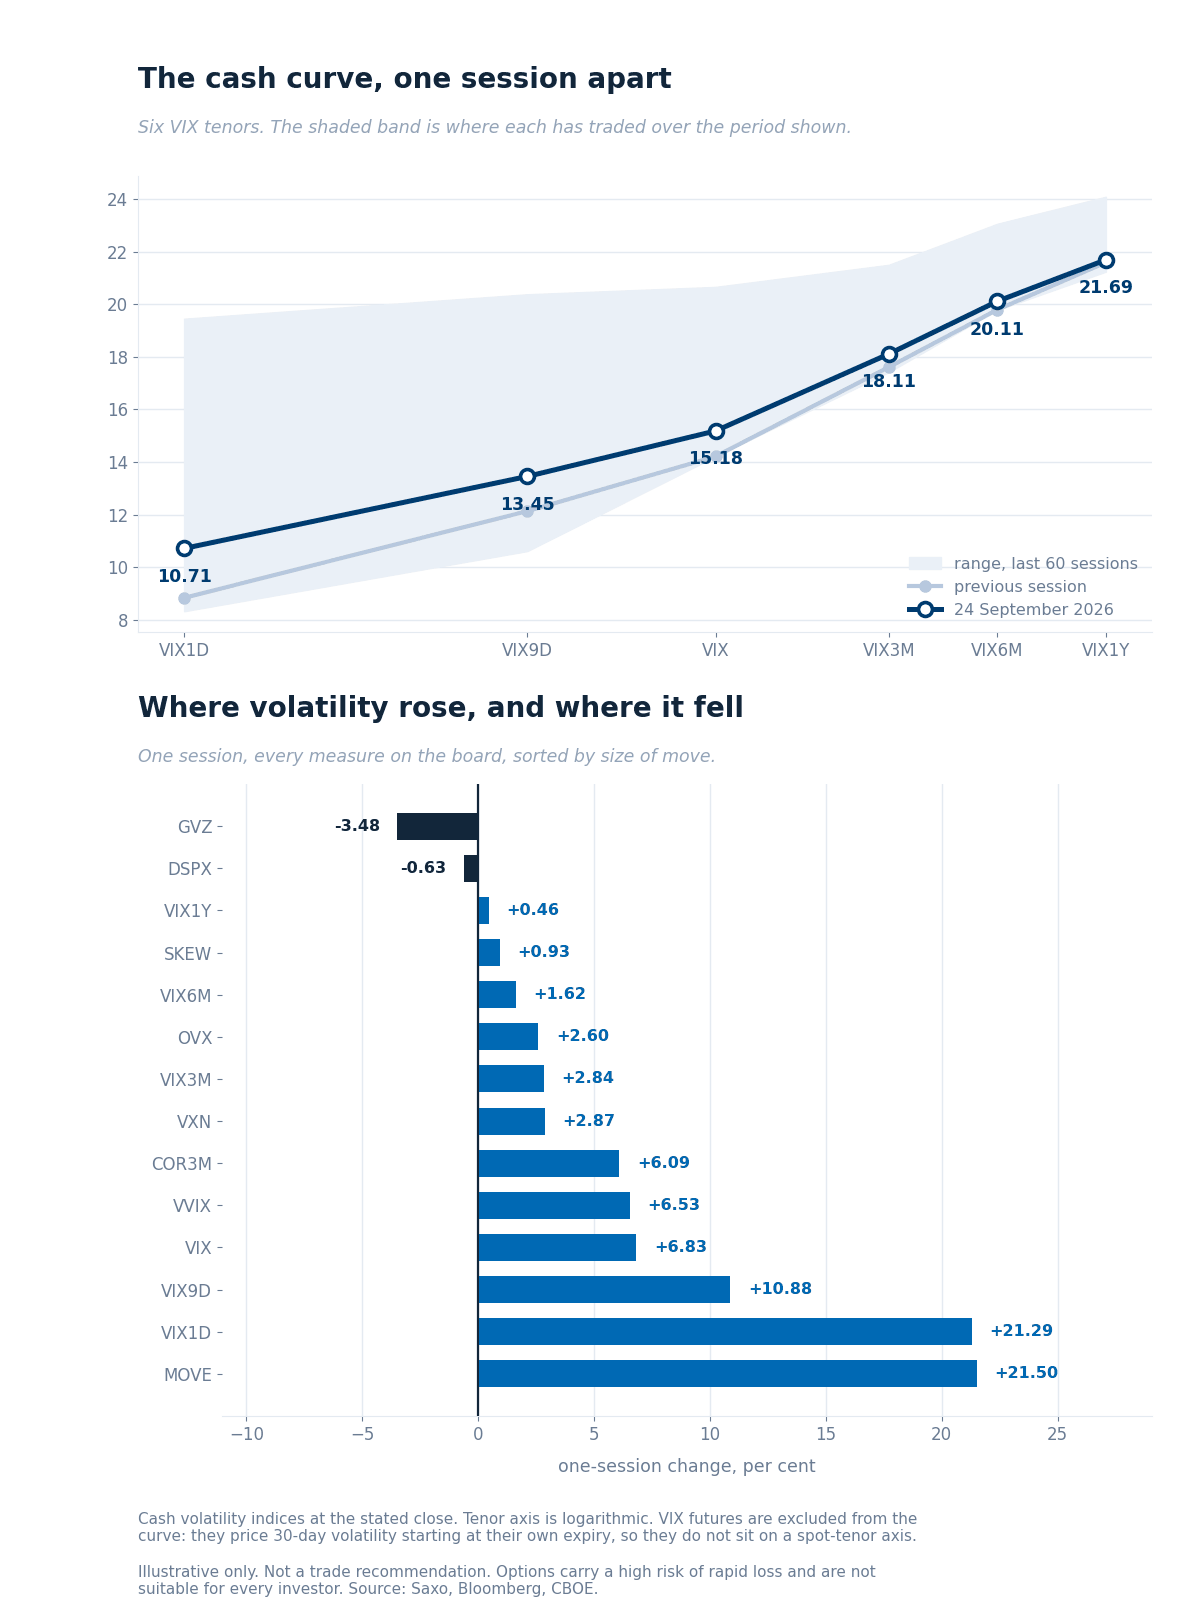 Expected move to the 25 September expiry, drawn around the Friday 18 September close with the nearest listed strike at each bound, and Wednesday’s close marked. Volatility uses the 21 October expiry, so its band covers a month. Read from the chain at Friday’s close, not a forecast.
- Four of the six have spent the week’s range, two in each direction. The Nasdaq 100 fund sits 185% through its 10.67 point band and the bitcoin fund 101% through, both above the upper bound; the energy fund 103% and gold 100% through the other way.
- The index itself still has room. The S&P 500 has used 66% of its 83.90 point band and volatility 12% of a month-long one. In our view a week that leaves the index mid-band while four of six run through theirs describes movement that is not arriving together. Options carry a high risk of rapid loss and are not suitable for every investor; see Saxo pricing for costs and charges on exchange-traded fund trades.
Today’s catalysts
Switzerland and Sweden announce policy rates at 09:30 CET, Norway at 10:00 CET alongside the German business climate survey, all ahead of the 15:30 CET US equity open.
Inside the session, US August new home sales arrive at 16:00 CET, with six hours of cash trading still to run to the 22:00 CET close. Policy speakers run through the day, one at 10:10 CET and three more between 14:30 CET and 16:10 CET.
Costco and H&M report today. The Chinese president’s Washington visit continues, with a two-month extension to the trade truce already agreed and expectations for a breakthrough low. Future outcomes are uncertain and may result in losses.
What the market is pricing
- Session implied move. SPX options price about 0.48% to tonight’s close, roughly 37 points, derived from at-the-money option pricing. New home sales at 16:00 CET falls inside a cash session running 15:30 CET to 22:00 CET.
- Event implied range. Friday’s expiry prices 0.70%, about 54 points, against 0.73% yesterday with one more session to run. Decay alone would have left 0.60%, so about 18% was added beyond the clock.
- Where volatility is being paid for. MOVE at 95.45 sits above every session in the three-month store; the VIX at 15.18 was exceeded on 43 of the previous 59. In our assessment the market is paying for movement in rates, not equity indices.
- Tail risk signal. SKEW firmed 0.93% to 146.15, in the upper third of the last three months with 20 of the previous 59 higher. In our view that pairs a market relaxed about ordinary movement with one still paying for the unusual.
Wednesday repriced the discount rate, not the earnings outlook. In our view the gap between bond volatility at a three-month high and an equity index near its own floor may close from either side. Options carry a high risk of rapid loss and are not suitable for every investor. Past performance is not indicative of future results.
Important note: The strategies and examples provided in this article are purely for educational purposes. They are intended to assist in shaping your thought process and should not be replicated or implemented without careful consideration. Every investor or trader must conduct their own due diligence and take into account their unique financial situation, risk tolerance, and investment objectives before making any decisions. Remember, investing in the stock market carries risk, and it’s crucial to make informed decisions.
| More from the author |
|---|