
Un seul compte Saxo suffit pour accéder à nos plateformes.

A day priced like a month - Options Brief - 2 November 2026
Options 10 minutes to read

Résumé: On Friday one day of S&P 500 protection came to cost as much as a month of it. Apple reports tonight and the midterm vote lands tomorrow. Is the market paying for a few sessions, or for something longer?
Friday’s tech selloff lifted the price of one day’s protection to the price of a month’s, and the curve between them all but disappeared.
MARKET REGIME: NEUTRAL / CHOP | VIX 19.42 | TERM STRUCTURE: CONTANGO | SKEW: ELEVATED (149.76) | FRONT-MONTH VIX FUTURES: 19.450
Today in brief
Friday’s selloff landed mostly on the front of the volatility curve. The one-day gauge jumped 41.92% to 19.33, level with the 30-day VIX at 19.42, while the one-year gauge rose only 2.29%. One session of protection now costs about the same, annualised, as a month of it. Options indicatively price 0.85% for today’s expiry and 1.84% for the 6 November expiry, against about 1.50% that time decay alone would have left from Friday morning’s reading, so in our view the market added premium to this week rather than letting the clock take it out.
In our view the week helps explain where the money went. It holds Apple tonight, the midterm vote on Tuesday, the Treasury’s refunding and payrolls. Apple is priced for 4.0% against an eight-report average of 2.5%, the richest on our scorecard.
In our view the reading that may cut the other way is correlation. Implied correlation, a gauge of how closely stocks are expected to move together, rose to 15.60, the highest in our 100-session store, and the index funds’ volatility ranks rose far more than the typical name’s. In our view that leans toward a market paying for the index to move as a block, not only for a few busy sessions.
The S&P 500 fell 1.82% to 7,580.07, its worst session since June, and the Nasdaq 100 3.46%, while the equal-weighted index lost only 0.79%. The week’s band starts at 1.84%, close to last week’s width. Friday’s flow was readable only in the semiconductor fund, where protection was bought, and futures trade higher this morning.
That is the whole brief in one read. The sections below hold the detail behind each paragraph, with the charts, the full set of readings and the sources, for when you want to go deeper on one part.
Headline driver
Friday was Wall Street’s worst session since June. The S&P 500 fell 1.82% to 7,580.07 and the Nasdaq 100 3.46%, while the equal-weighted S&P 500 lost only 0.79%. The selling sat in technology: the semiconductor fund fell 6.98%, Intel 28.6% on a weak fourth-quarter outlook and Reddit 29.2% on a user-growth warning. Amazon, which fell about 7% in late trade on Thursday, closed Friday down only 1.4%.
Over the weekend oil eased. Brent trades about 3% lower near 110 as Qatari and Iranian officials met for a third day, and the US President pledged no further strikes before Tuesday’s midterm vote. China’s official manufacturing index fell to 49.3, back in contraction.
Market snapshot
- US (Friday 30 October close): S&P 500 7,580.07, down 1.82%. Nasdaq 100 28,384.85, down 3.46%. Dow Jones Industrial Average 51,775.17, down 1.09%. The equal-weighted S&P 500 fell 0.79%, the technology sector fund 4.89%, while energy rose 1.91%.
- Europe: the Stoxx 600 slipped 0.36% to 646.76, the DAX 0.85% to 25,818.21 and the CAC 40 was flat. Banks fell 2.21%. ASML lost 6.1%, while AstraZeneca rose 7.0% on its results.
- Asia (Monday morning): the Kospi rose 2.28% to 5,861.59 by 05:00 CET and the Hang Seng 0.61%.
- Commodities and rates: WTI trades at 100.63 and Brent at 110.02. Gold futures sit at 3,913.10 after a one-year low on Friday, and silver at 50.12. The two-year Treasury yield trades near 4.60% and the ten-year at 4.92%, while high-yield spreads widened 17 basis points to 340. Bitcoin trades near 78,800.
- Overnight (05:00 CET Monday): S&P 500 futures 7,651.25, up 0.49%, and Nasdaq 100 futures 28,801.00, up 0.94%, each against its own Friday settlement.
- Market regime: neutral / chop, the VIX at 19.42, the cash curve in contango and SKEW elevated at 149.76.
Index levels and volatility readings from the watchlist export taken at 05:00 CET on 2 November 2026, which carries Friday’s US closes; rates, oil, Asian detail and single-stock moves from the same-morning Saxo Market Quick Take. Past performance is not indicative of future results. Source: Saxo, Bloomberg, CBOE.
Volatility surface
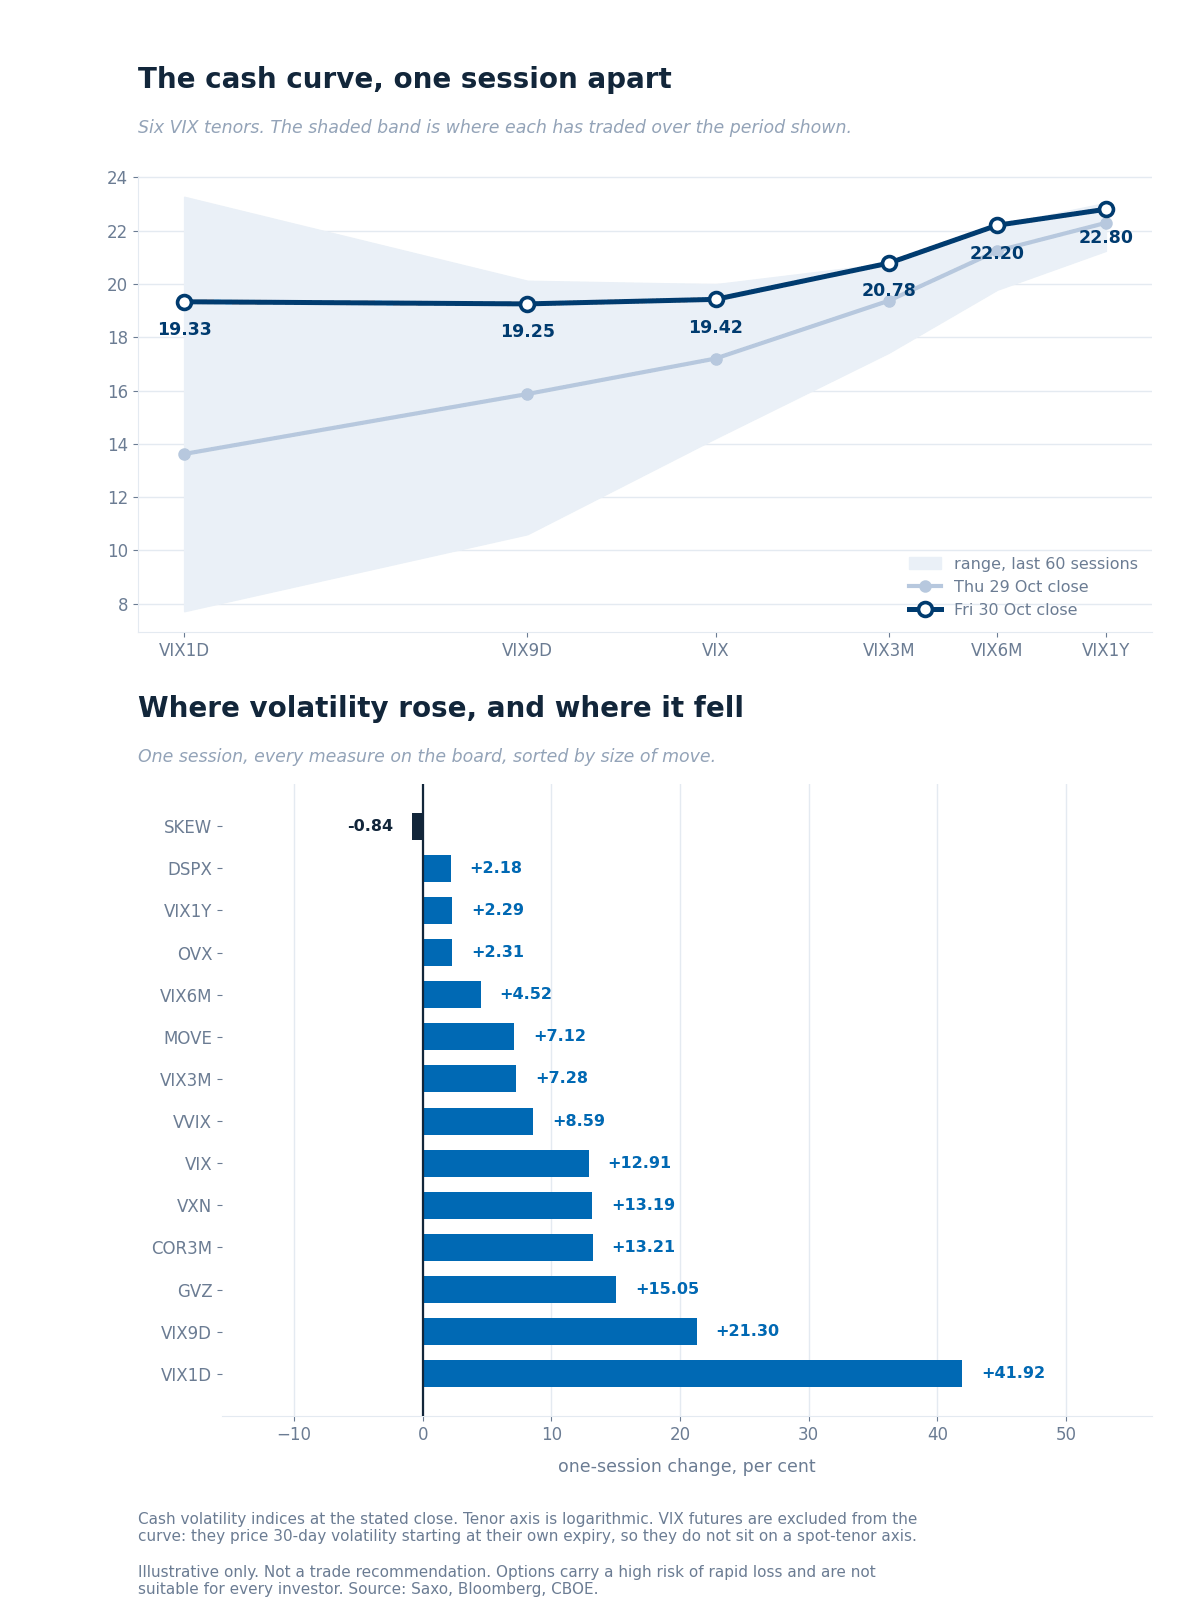
The cash curve at Friday’s close against Thursday’s, over each tenor’s 60-session range, with the one-session change across every measure. Illustrative only. Past performance is not indicative of future results. Source: Saxo, Bloomberg, CBOE.
The front of the curve did nearly all the moving. The one-day gauge jumped 41.92% to 19.33 and the nine-day 21.30% to 19.25, against 12.91% for the 30-day VIX at 19.42 and 2.29% for the one-year at 22.80. One session of protection now costs about the same, annualised, as a month of it.
Implied correlation, a gauge of how closely stocks are expected to move together, rose 13.21% to 15.60, the highest in our 100-session store, which starts in mid-June. Dispersion rose only 2.18% to 37.43, near its median. The Nasdaq gauge added 13.19% to 28.50 and the bond gauge 7.12% to 100.21.
Ratios. VIX1D/VIX rose to 0.995 from 0.79. VIX3M/VIX fell to 1.07 from 1.13, the flattest 6% of the store, so the cash curve is still in contango, narrowly. VXN/VIX holds at 1.47.
VIX futures. November reads 19.45 in overnight trade, 0.91 below its Friday settlement and above December at 19.20, so the front of the futures curve stays inverted on that quote. Put-call parity on the 18 November options at Friday’s close returned 20.16, close to that settlement, so the series has not rolled.
Tails. SKEW eased 0.84% to 149.76, above its 145.95 median.
Single-name volatility
The index funds repriced far more than the names inside them. On a common set of 524 underlyings the median implied-volatility rank rose only to 40.6 from 39.5, and the mean to 44.2 from 41.5, with 384 names up and 129 down.
The wrappers moved much further. The S&P 500 fund went to 32.6 from 13.2, the Nasdaq 100 fund to 71.0 from 40.7 and the technology sector fund to 83.5 from 39.3, the largest rise in the universe. In our view that matches the correlation reading above: the bid was for the block, not for any one name.
Amazon went the other way, down 45.8 points to 33.4 once its results were out. Intel fell 28.6% and its rank barely moved, to 26.4 from 27.6. Nvidia rose 20.8 points to 65.8, and Apple, which reports tonight, sits at 76.8, the 90th percentile of its year.
By group, metals rose to 30.2 from 17.7 and crypto to 58.1 from 44.5, while the mega-cap group eased to 35.4 on Amazon.
Implied-volatility rank and percentile from the Saxo screener, read at 03:02 CET on 31 October 2026, carrying Friday’s close. Source: Saxo.
Options flow sentiment
Based on end-of-day Friday 30 October, yesterday’s positioning, not today’s price action.
- Single-name flow carried no readable direction. The largest lines in the heaviest tech names were existing positions being rolled, and fresh calls were sold about as often as bought.
- Sector and ETF flow was readable in one place only: protection bought on the semiconductor fund. Nine of the ten categories showed no direction.
Where the week's range sits
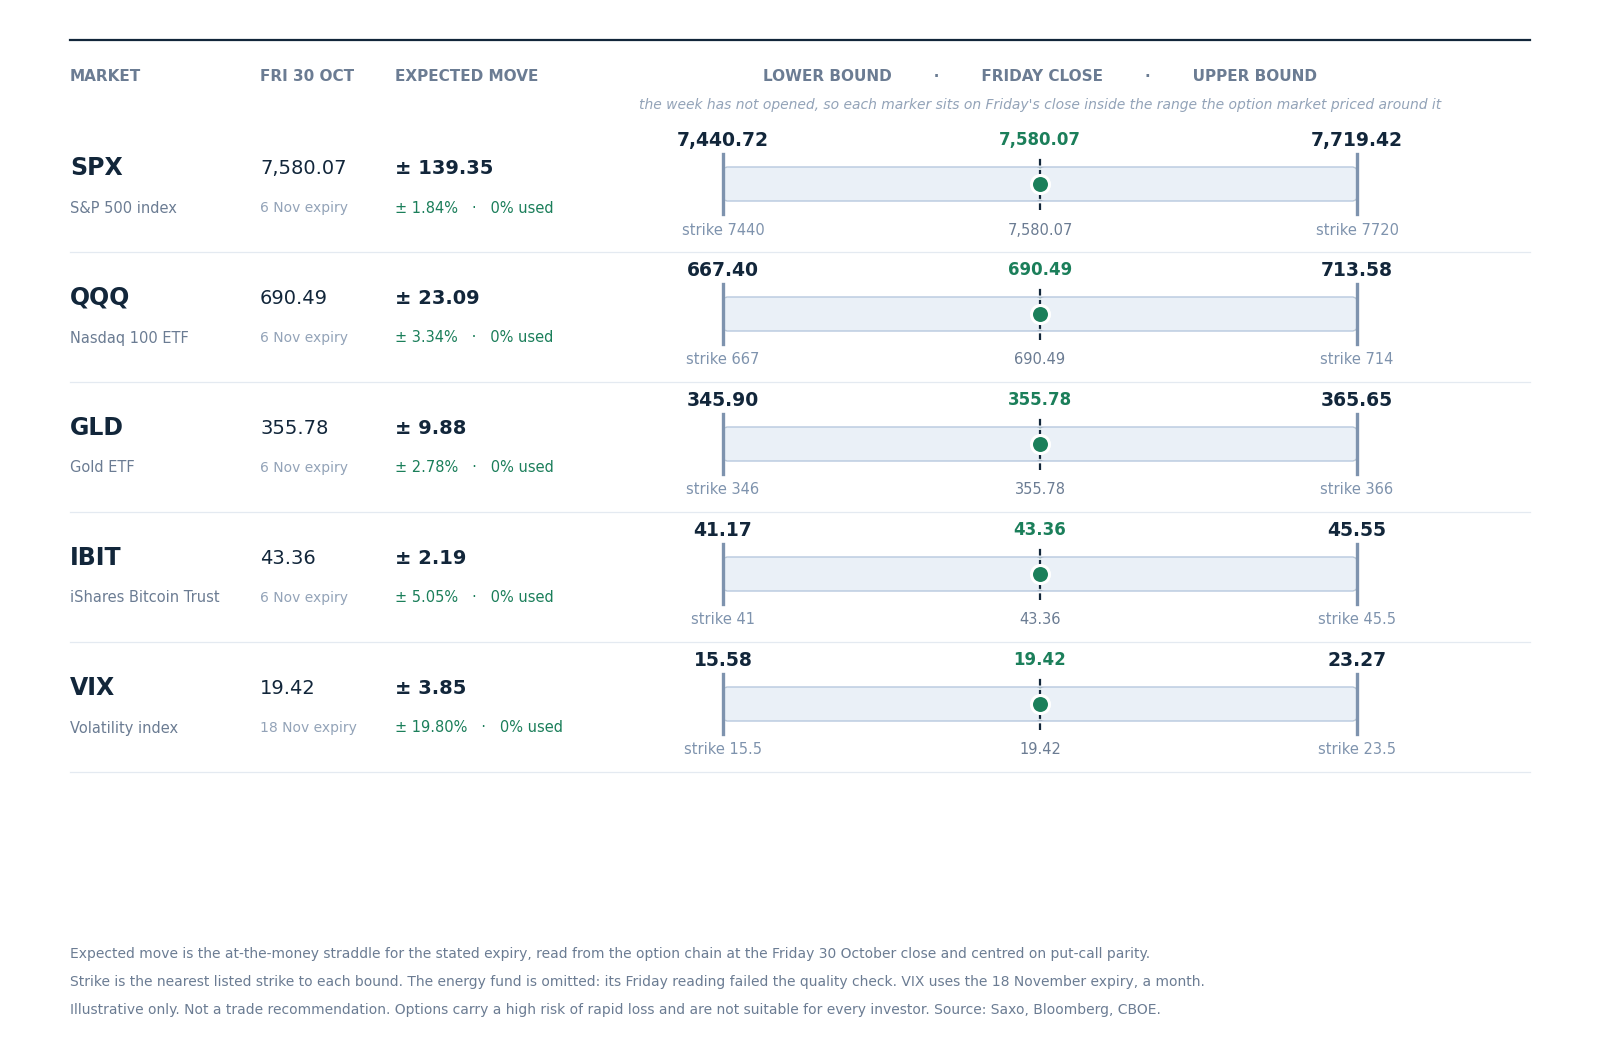
The range the option market priced for this week around Friday 30 October’s close. The week has not opened, so no marker has moved. Illustrative only, not a trade recommendation. Past performance is not indicative of future results. Source: Saxo, Bloomberg, CBOE.
The S&P 500 begins the week with 139.35 points priced around Friday’s close, 1.84%, from 7,440.72 to 7,719.42, nearest strikes 7440 and 7720. Last week’s band was 137.05 points, so the width is close to unchanged even though the window now holds the midterm vote, Apple, the Treasury’s refunding and payrolls.
Last week ended with 32% of its band used downward, a session after sitting 71% upward. The Nasdaq 100 fund begins at 3.34%, gold at 2.78% and the bitcoin fund at 5.05%. The energy fund’s Friday reading failed our quality check and is left out. The volatility row uses the 18 November expiry, so it measures a month, not a week.
Options carry a high risk of rapid loss and are not suitable for every investor. Costs and charges apply and vary by account and venue; check the rates applicable to you.
Today's catalysts
- 10:00 CET final euro-zone manufacturing purchasing managers’ indexes for October.
- 15:45 CET the final US manufacturing purchasing managers’ index, and at 16:00 CET the ISM manufacturing index.
- Earnings today: Apple and Palantir after the US close, with Vertex Pharmaceuticals, Marriott International, Williams and Diamondback Energy.
- This week: the US midterm vote and the Reserve Bank of Australia on Tuesday, with AMD; the Treasury’s quarterly refunding and Novo Nordisk on Wednesday; the Bank of England on Thursday; payrolls on Friday.
The US moved to winter time on Sunday, so from today the cash session runs 15:30 to 22:00 CET and today’s expiry settles at that close.
Earnings scorecard
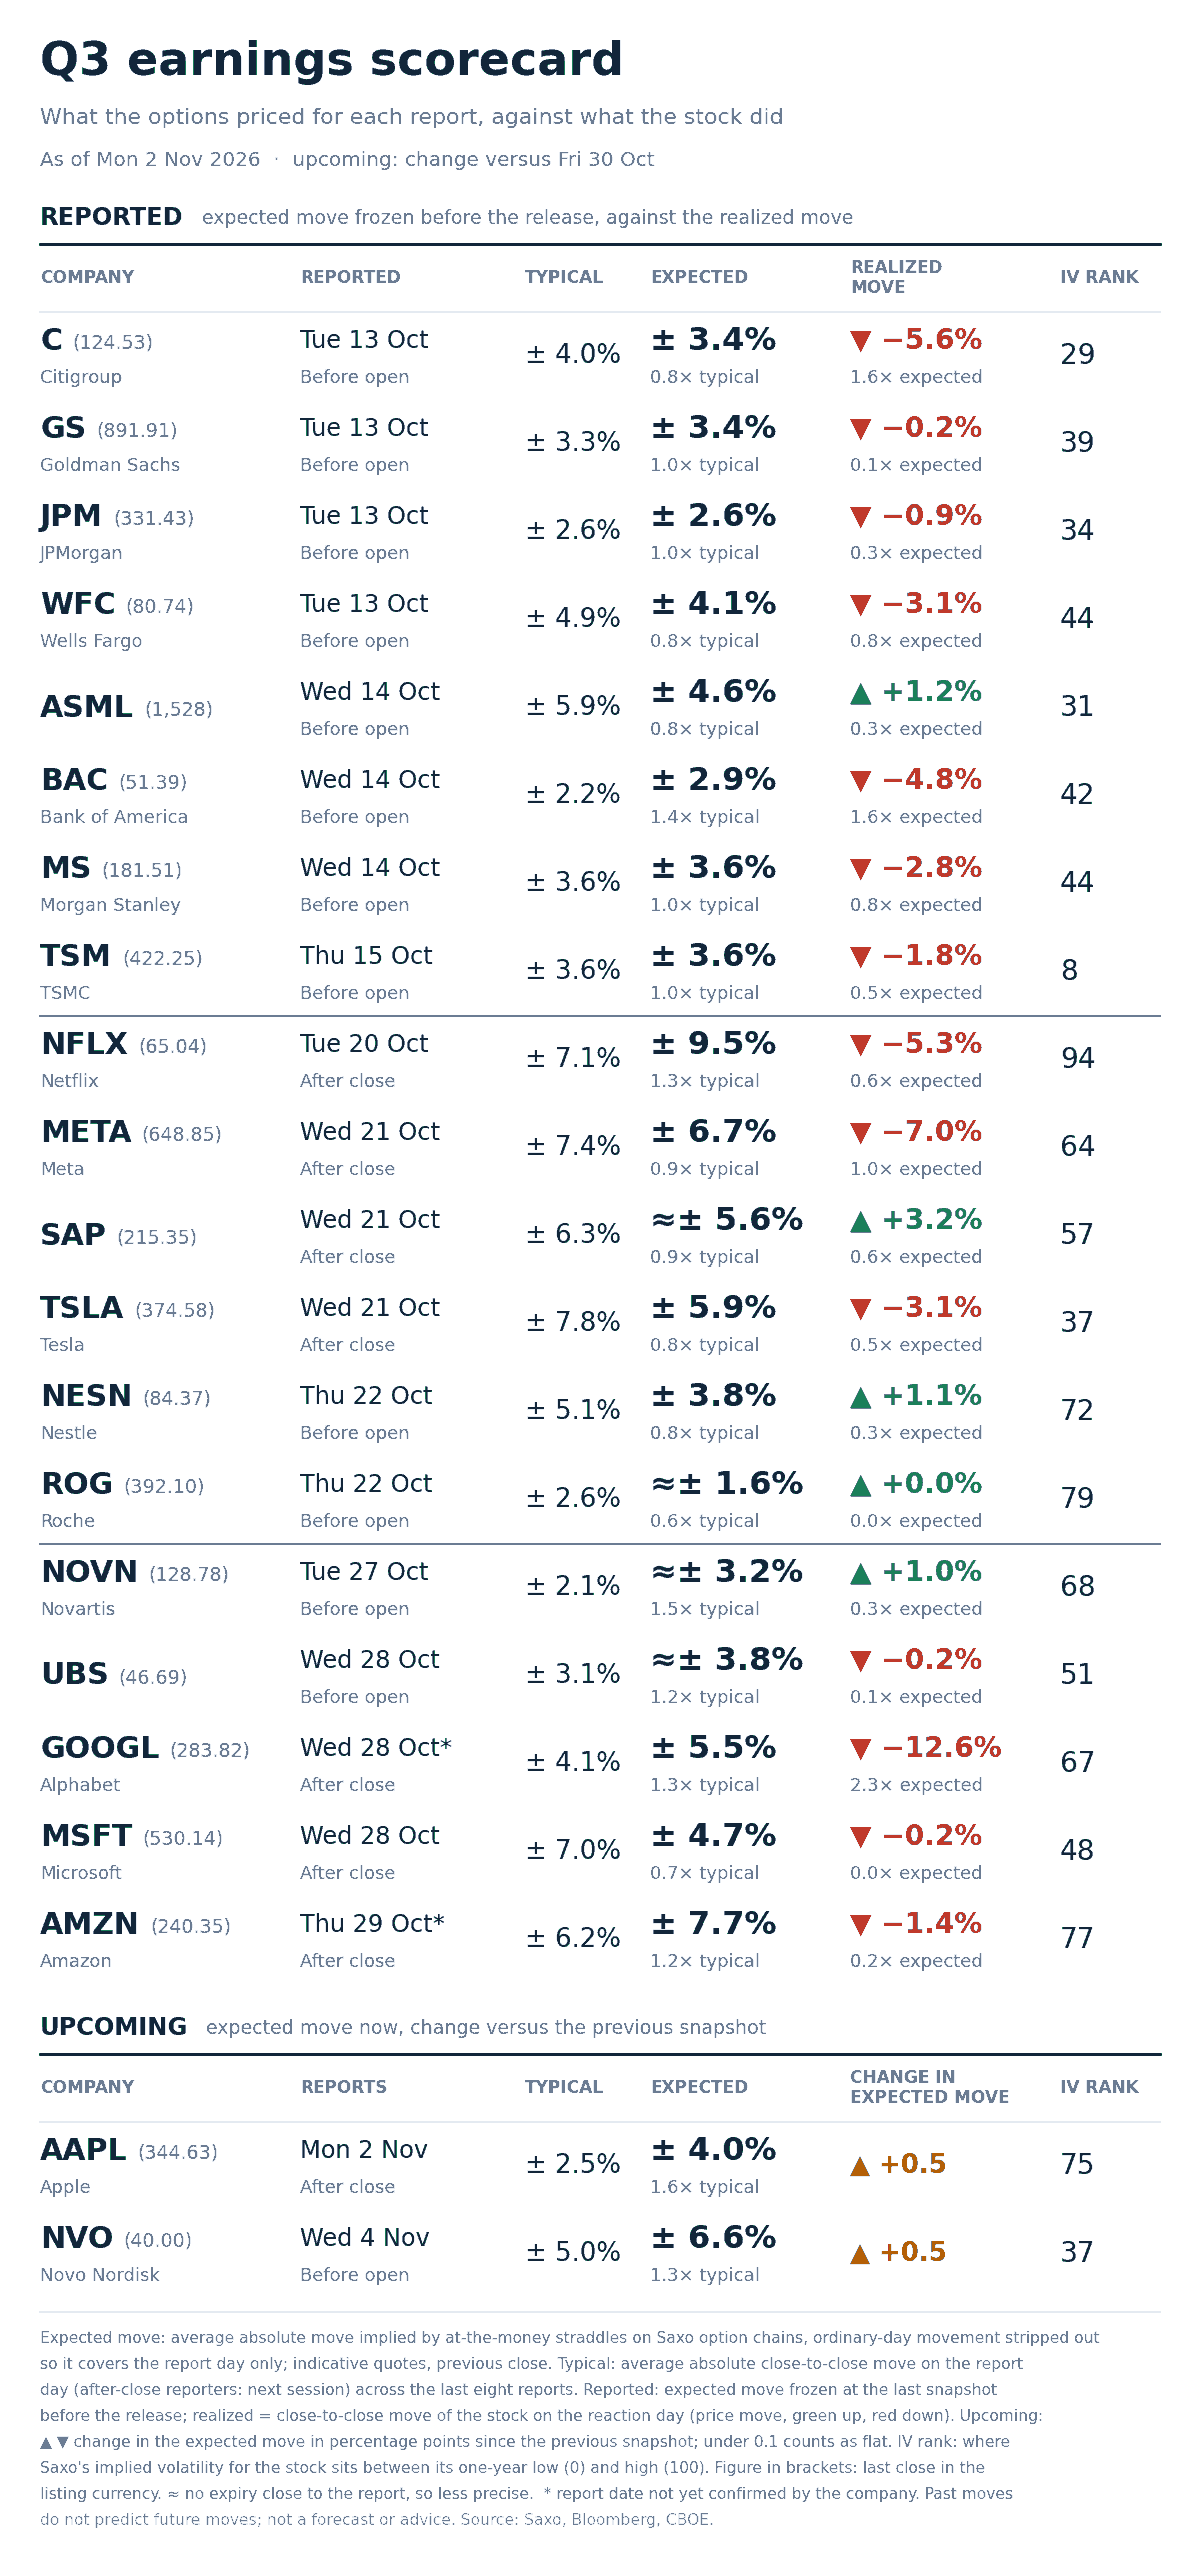
Option-implied expected move for each report day against the stock’s average move after its last eight reports, across the twenty-one names tracked this season. Past performance is not indicative of future results. Source: Saxo, Bloomberg, CBOE.
Amazon’s figure is in. It was priced for 7.7% and closed Friday down 1.4%, 0.2x what the options expected, after a late-trade fall of about 7% on Thursday faded. Nineteen of the twenty-one names have now reported.
Apple reports tonight priced for 4.0% against an eight-report average of 2.5%, 1.6x its own history, up 0.5 points since Friday’s scorecard and the richest on the board. On the scorecard its rank is 75, which in our view suggests both its volatility level and its event premium sit high going in.
Novo Nordisk reports on Wednesday at 6.6% against 5.0%, 1.3x, on a rank of 37.
Options carry a high risk of rapid loss and are not suitable for every investor. Costs and charges apply and vary by account and venue; check the rates applicable to you.
What the market is pricing
- Session implied range: S&P 500 options price 64.30 points, 0.85%, for today’s expiry, which settles at the 22:00 CET close. Read before the US open, so indicative. The one-day gauge at 19.33 implies about 1.22%, a one-sigma figure rather than an expected move, so in our view the two do not disagree.
- Event repricing: on Friday morning the Quick Take put about 1.64% on the 6 November expiry with six sessions to run. Time decay alone would have left about 1.50%. Today it prices 1.84%, so in our view the option market added premium to this week rather than letting the clock take it out.
- Curve read: the one-day gauge now sits level with the 30-day VIX, a ratio of 0.995, higher than 97% of the readings in our store. In our view that leans toward the market paying for the next few sessions specifically, the vote and the data, more than for a longer stretch of stress.
- Correlation read: implied correlation at 15.60 is the highest in our 100-session store while dispersion sits near its median, and the index funds’ ranks rose far more than the typical name’s. In our view the market prices the next move to travel across the index as a block.
In our view this week tests whether Friday was a repricing of the next few sessions or the start of something longer, and the flat curve says the market currently leans to the first. Options carry a high risk of rapid loss and are not suitable for every investor. Costs and charges apply and vary by account and venue; check the rates applicable to you. Past performance is not indicative of future results.
| More from the author |
|---|