
You can access all of our platforms from a single Saxo account.

Correlation falls, the index stays quiet - Options Brief - 16 October 2026

Summary: Implied correlation fell almost six per cent to 12.04 while the equal-weighted index rose four times as fast as the headline one. The index is not calm, its components are cancelling.
Implied correlation fell almost six percent, the largest move on the board.
MARKET REGIME: TRANSITIONING | VIX 16.46 | TERM STRUCTURE: CONTANGO | SKEW: ELEVATED (160.45) | FRONT-MONTH VIX FUTURES: 17.47
Key findings
- Correlation did the work, not calm. Three-month implied correlation fell 5.94% to 12.04, the largest single move on the board, while the equal-weighted S&P 500 rose 1.36% against the headline index’s 0.33%.
- The index is the quietest thing on the screen. Saxo’s volatility ranks put the four large index funds at a median of 17.8 and the seven largest technology names at 58.0, a gap of 40 rank points.
- Volatility did not leave, it moved. The bond market measure rose 3.45% to 102.50, the biggest riser on a board where nine of fourteen measures fell.
- Widest earnings premium against own history: Novartis at 1.4x, Apple at 0.3x.
Headline driver
September producer prices rose 1.3% on the month against 0.5% expected, the largest increase since March 2022, energy-led at 10.8%. Core rose 0.7% and the annual rate reached 6.3%. Retail sales beat at 0.8%, though petrol stations carried most of it and the control group added 0.1%.
The market read the composition, not the headline. Treasuries rallied, the 10-year yield bottoming below 5.04% before recovering above 5.08%, still some 12 basis points below its level before the consumer price release. Pricing for a 28 October Federal Reserve increase fell back to 15%.
In our view that is why the session rotated rather than fell. Money left the chipmakers for healthcare, banks and smaller companies, and the index barely moved because the two sides cancelled. Options carry a high risk of rapid loss and are not suitable for every investor.
Market snapshot
Levels are as of the 06:00 CET snapshot on 16 October 2026. US and European figures are the Thursday 15 October close; Asian figures are Friday’s session.
- US (Thursday 15 October close): S&P 500 7,744.06, up 0.33%. Nasdaq 100 29,935.59, down 0.05% after recovering a steep intraday fall. Dow 52,183.23, up 1.08%. The equal-weighted S&P rose 1.36% and the Russell 2000 fund 1.37%, four times the headline index. Nvidia fell 1.84%, Tesla 1.29% and the semiconductor fund 1.04%; healthcare rose 1.86%, financials 1.38% and retail 3.68%. Microsoft was the exception, up 1.08%.
- Europe (Thursday 15 October close): Stoxx Europe 600 up 0.38% to 640.17, led by healthcare. The CAC 40 rose 0.78% and the DAX 0.33%, the Euro Stoxx 50 fell 0.36%, and the FTSE 100 closed around 10,840, up 1.1%.
- Asia (Friday session): Kospi up 4.11% to 5,782.62, Nikkei 225 1.80%, Hang Seng 1.21% and the CSI 300 0.75%.
- Commodities and rates: Brent holds above 105, WTI 95.67. Gold futures rose 0.82% to 4,204.5, a second day higher, the silver fund 3.39%, the miners fund 4.34%. The 10-year Treasury yield is 5.069%, the 2-year 4.742% and the 30-year 5.415%, derived from the prior session’s export, not the file’s change column.
- Market regime: Transitioning. VIX 16.46, 20-day realised volatility 9.37%, stable, the index 0.48% above its 50-day average.
Past performance is not indicative of future results. Source: Saxo, Bloomberg, CBOE.
Volatility surface
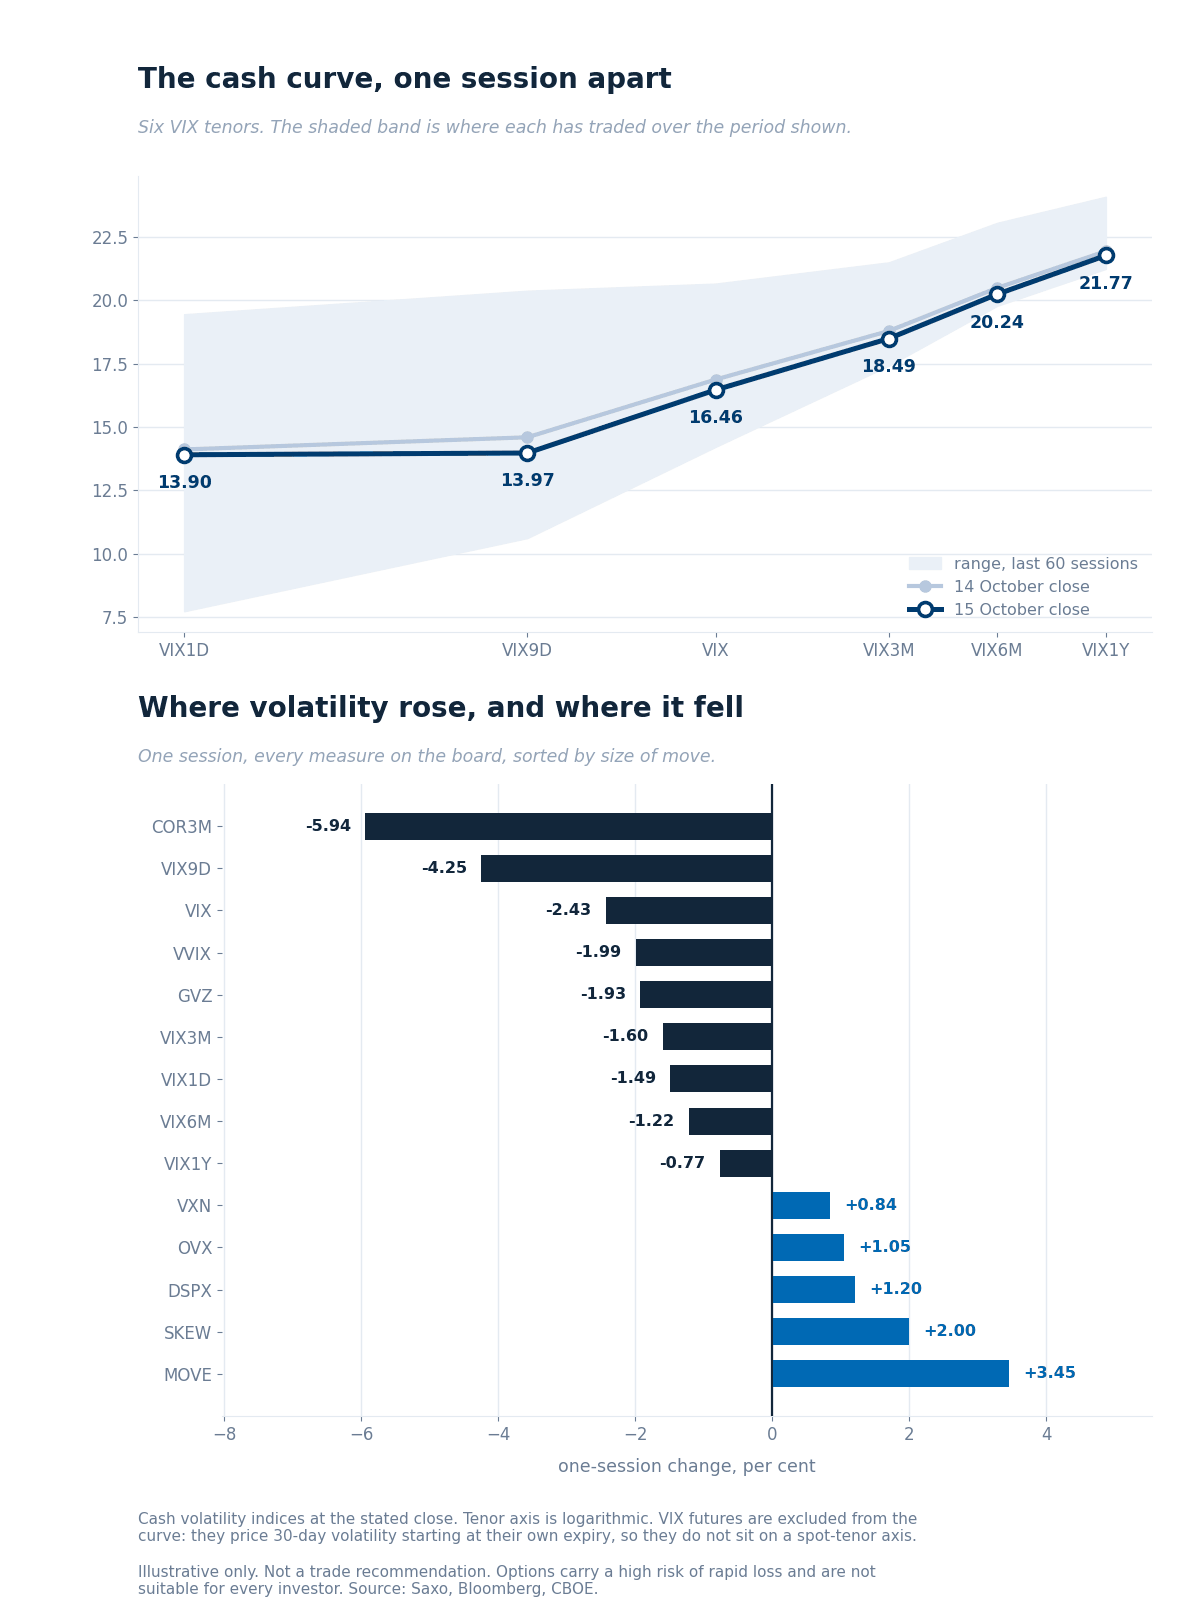
The cash curve against the previous session, over each tenor’s 60-session range, with the one-session change across every measure on the board. Source: Saxo, Bloomberg, CBOE.
Every tenor fell and the curve kept its shape. VIX1D eased 0.21 to 13.90, the nine-day measure 0.62 to 13.97, the 30-day 0.41 to 16.46, the three-month 0.30 and the one-year 0.17. The front gave back most of Wednesday’s spike; the back never registered it. Contango runs 13.97 to 21.77 at one year.
Ratios. VIX3M/VIX rose to 1.12 from 1.11. VXN/VIX widened to 1.39 from 1.34, the Nasdaq premium growing on a session the Nasdaq underperformed by a third of a percent. It marks where volatility is concentrated, not the size of the move.
VIX futures. The 21 October option expiry gives a parity forward of 17.47, consistent to 0.15 across the five nearest strikes, a premium to spot of 1.01 points. A session ago the same expiry gave 17.68 at a premium of 0.81: the forward eased while the premium widened, because spot fell further. The feed’s continuous series reads 17.85 and reconciles with neither parity nor its stored prior, so no comparison is drawn from it.
Rates and correlation. The bond market volatility measure rose 3.45% to 102.50 on a day the 10-year yield fell about 3 basis points, the one place on the board where volatility got dearer. The Treasury fund gauge rose 5.17% to 15.67. Three-month implied correlation fell 5.94% to 12.04, dispersion rose 1.20% to 37.04.
Single-name volatility
Saxo’s one-year implied-volatility ranks, read at Thursday’s close across 187 US names, show the distribution widening at both ends.
- Both tails grew and the middle fell. The median rank eased to 43.9 from 44.6 on an identical set of names, so the comparison needs no caveat. Underneath it, names below rank 20 rose from 12.8% to 15.0% of the set and names above 70 from 13.9% to 14.4%. A session that fattens both ends while the centre slips is dispersion arriving in the single names.
- The index funds are the cheapest thing on the board. The four large index funds carry a median rank of 17.8, down 4.5 on the day, with the S&P fund at 13.4, the Russell fund 16.9 and the Dow fund 18.8. The seven largest technology names sit at 58.0 and rose 1.4. Alphabet is the richest of them and Nvidia the cheapest.
- Financial volatility is coming out now the reports have cleared. The group’s median rank fell 5.0 to 27.6, the largest group move of the session, which is the usual pattern once an event has passed.
- A big move with no volatility bid. The metals group sits at a median rank of 19.1 with half its members below 20, on a session the gold miners fund rose 4.34%. Europe barely moved: across 329 names the median was 47.5 against 47.7.
Past performance is not indicative of future results. Source: Saxo.
Options flow sentiment
Based on end-of-day 15 October, yesterday’s positioning, not today’s price action.
October monthly expiry mechanics dominated the tape: deep in-the-money packages, cumulative-volume fragments and mid-market prints inside multi-leg codes. All ten reports score their own conviction at two or three out of five. Treat it as neutral.
One line is worth naming against the day’s reading, because it cuts the other way: a large opening purchase of 30 October Nasdaq fund puts, lifted at the offer, in the expiry that spans the Federal Reserve decision. That is index-level hedging demand on a session when index volatility fell.
Where the week's range sits
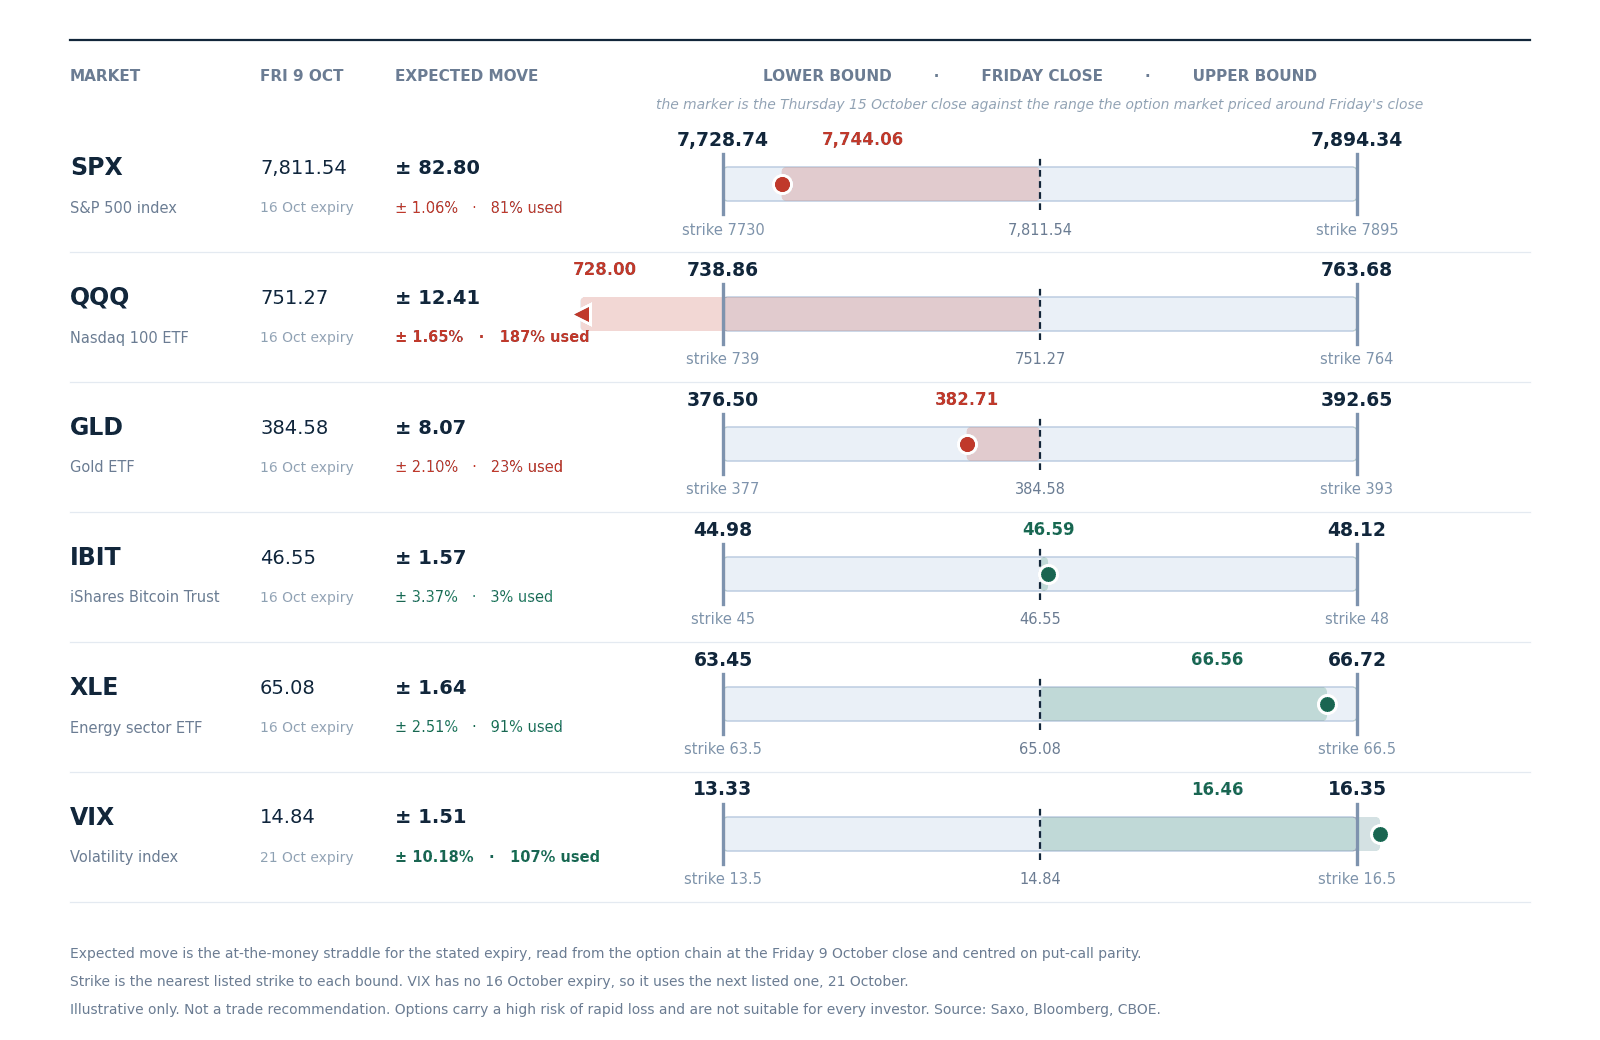
The range the option market priced for this week around Friday 9 October’s close, with the nearest listed strike at each bound and the Thursday 15 October close as the marker. Figures are at-the-money straddles read from the Saxo chain at Friday’s close and centred on put-call parity. Illustrative only, not a trade recommendation. Source: Saxo, Bloomberg, CBOE.
With the week’s expiry falling today, four of the six rows have come back inside the range priced for it. The S&P 500 has spent 81% of its 82.80-point range, energy 91%, gold 23% and bitcoin’s fund 3%. Two remain outside: the Nasdaq 100 fund at 187% of its 12.42-point range and the VIX at 107%.
Yesterday five of the six sat outside with one session to run. That reversal is the week in one line: the range was breached midweek, then recovered, and what recovered it was not the index moving back but the components moving apart far enough to cancel.
Options carry a high risk of rapid loss and are not suitable for every investor. Costs and charges apply and vary by account and venue; check the rates applicable to you before entering any position.
Today's catalysts
- September import and export price indices at 14:30 CET, the third inflation read of the week after consumer and producer prices.
- September industrial production at 15:15 CET, with Canadian housing starts at 14:15.
- Today is the October monthly expiry, the largest open-interest roll of the month, which tends to loosen pinning into the afternoon.
- Earnings: Investor AB and Truist Financial, with Netflix, SAP and Tesla next week ahead of the 28 October Federal Reserve decision now priced at 15% for an increase.
Earnings scorecard
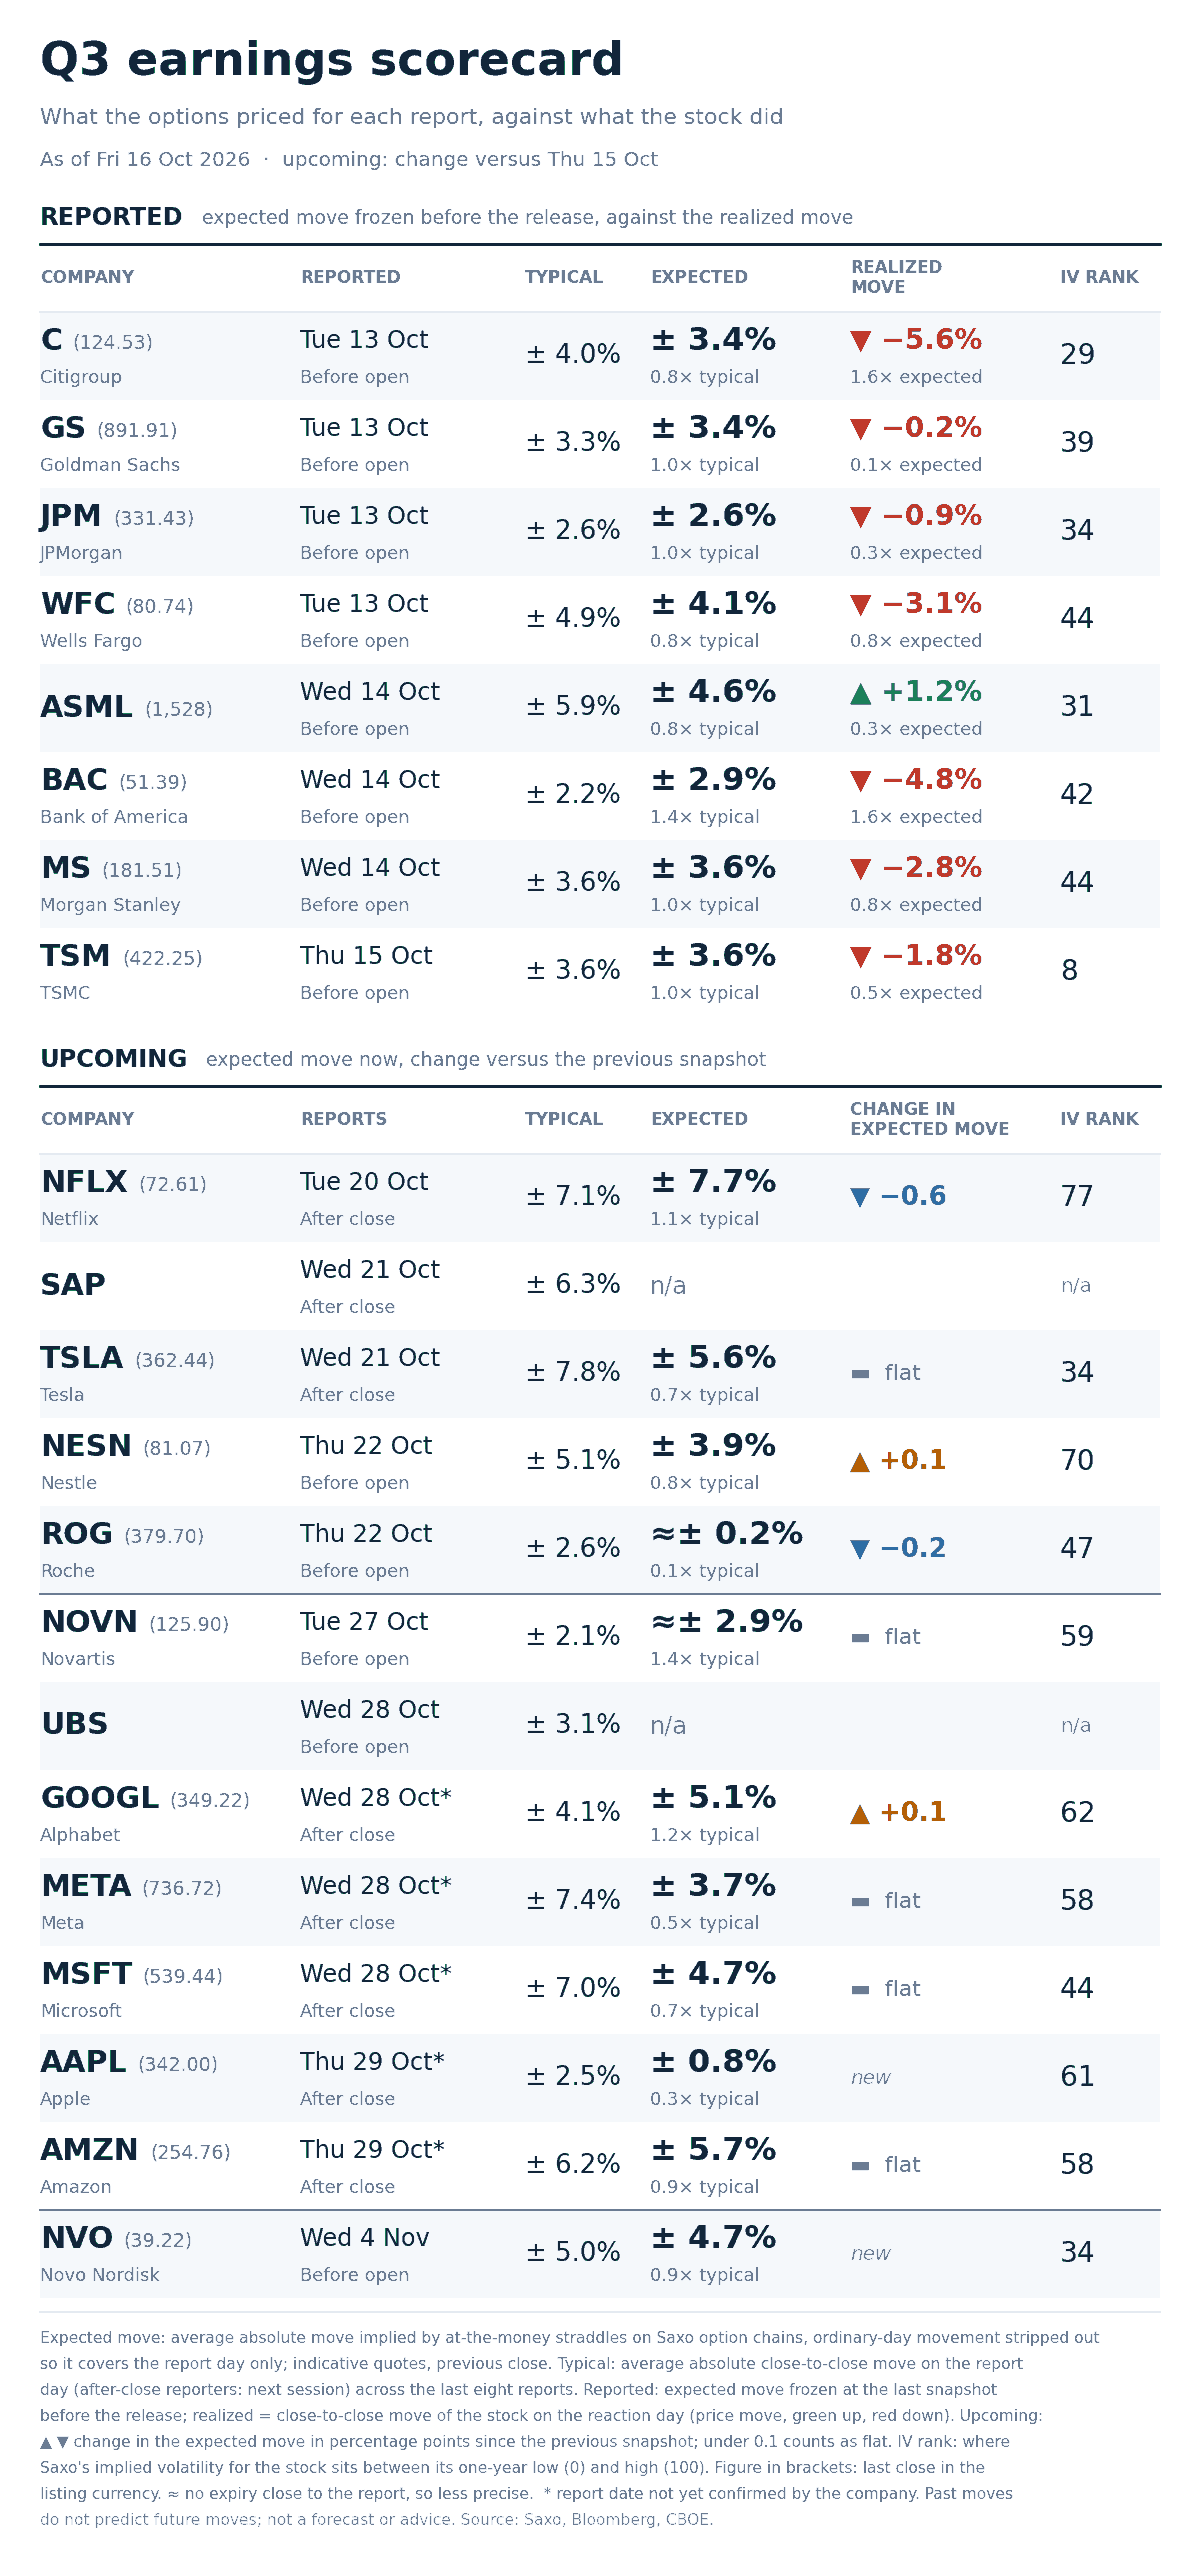
Option-implied expected move for each report day against the average move after the last eight reports, with implied-volatility rank and last close, as of 16 October 2026. Illustrative only, not a trade recommendation. Source: Saxo, Bloomberg, CBOE.
- Six of the eight that have reported moved inside what was priced. Goldman Sachs came in at 0.1x its expected move, JPMorgan 0.3x, ASML 0.3x and TSMC 0.5x. Only Citigroup, at 5.6% against 3.4%, and Bank of America, at 4.8% against 2.9%, exceeded it, both at 1.6x.
- The widest premiums against own history are European healthcare and Alphabet. Novartis prices 2.9% against a 2.1% eight-report average, 1.4x, and Alphabet 5.1% against 4.1%, 1.2x. At the other end Apple prices 0.8% against 2.5% and Meta 3.7% against 7.4%.
- Rank and event premium answer different questions. Apple carries an implied-volatility rank of 61, the upper half of its year, yet prices only 0.3x its own eight-report average. Netflix carries 77 and prices 1.1x. Rank measures the level against the name’s own past; the expected move measures what one day costs.
- Next up: Netflix on 20 October, SAP and Tesla on 21, Nestle and Roche on 22.
Options carry a high risk of rapid loss and are not suitable for every investor. Costs and charges apply and vary by account and venue; check the rates applicable to you before entering any position.
What the market is pricing
- Session implied range: today’s expiry prices 41.65 index points, 0.54%, on a parity forward of 7,746.25. Yesterday’s priced 47.65 points, 0.62%.
- Event implied range: the 23 October expiry prices 100.25 points, or 1.29%. Today’s expiry priced 65.05 points a session ago with two to run, where decay alone leaves about 46.0. It printed 41.65, so roughly 4.4 points came out beyond what the clock explains: premium that went in through the consumer price print came out through the producer price print.
- Correlation read: three-month implied correlation fell 5.94% to 12.04 while dispersion rose 1.20% to 37.04. Correlation down with dispersion up is a rotation, the mirror of yesterday.
- Tail risk signal: SKEW rose 2.00% to 160.45, a new high above all 60 stored sessions, on a day the 30-day measure fell: far downside protection got dearer as index volatility got cheaper.
In our view the open question is whether the components keep disagreeing. Index volatility this low says the pieces are offsetting, not that risk has gone, and correlation at 12.04 leaves little room to offset harder. The 28 October Federal Reserve decision is the likeliest thing to move them together.
Options carry a high risk of rapid loss and are not suitable for every investor. Costs and charges apply and vary by account and venue; check the rates applicable to you before entering any position. Past performance is not indicative of future results.
This material is produced for informational and educational purposes only and does not constitute investment advice or a recommendation to buy or sell any instrument. Options involve significant risk and are not suitable for all investors. Figures quoted are derived from option-implied pricing at the stated snapshot times and may change rapidly.
| More from the author |
|---|