Quarterly Outlook
Q1 Outlook for Traders: Five Big Questions and Three Grey Swans.
John J. Hardy
Global Head of Macro Strategy
Strap yourself in for key market questions that must be answered in 2026.

Summary: With all the major central banks expected to be effectively zero bound in 2020, the scope for returns in bonds will be low for years to come.
Equities have hit multiple speedbumps since 2008. But every time, they came back to new all-time highs fuelled by endless policy action, mostly from central banks. Through quantitative easing and lower rates, central banks have engineered a now-evidently unsustainable investment boom in energy that cannot repay it itself, large-scale buyback programmes among US companies and ever-higher valuations for growth companies.
The US-China trade war already started disrupting supply and slowing growth over the last year. In Q1 2020 the world economy was hit by the COVID-19 virus outbreak, creating both a supply (Chinese lockdown) and demand (lockdowns in many countries) shock, in addition to an oil price war between Russia and Saudi Arabia which threatens to significantly impact the US oil industry and global investments in general.
Not since 2008 has the world been this uncertain and out of balance. As equity prices reflect the future and growth prospects, they are the most sensitive to current crisis. Investors are desperate to get out and cash in on years of fat profits.
The last couple of months have given investors a glimpse of what’s lurking around the corner. Countries have entered lockdown, hospitals have been overstretched and demand for certain products and services has been in freefall. The three most important questions for equity investors, then, are:
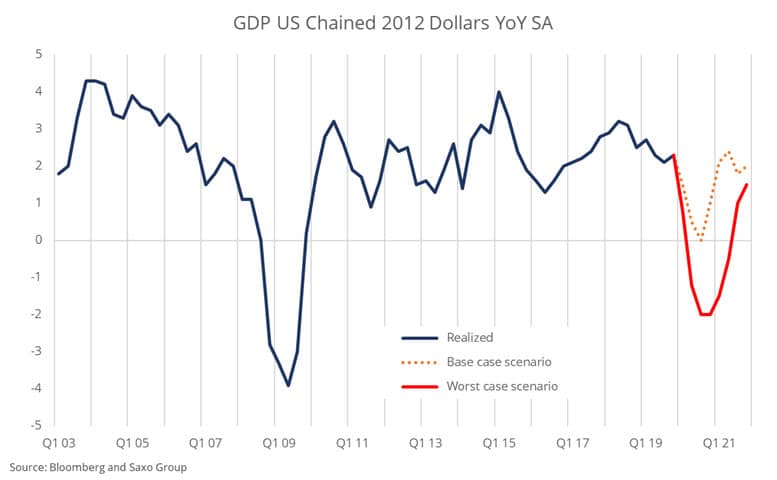
As global pandemics of this type are very rare, all GDP forecasting models can be tossed out the window. We have instead tried to create two types of GDP paths. One is a mild shock to 0% GDP growth and then a quick reversion to trend growth. The other is a 4% drop in growth in a few quarters and a slower recovery that doesn’t quite hit trend growth. Many market participants believe in the base case scenario. But with dramatic lockdowns in Europe and the potential for COVID-19 to become seasonal the impact could become deeper and longer.
Based on data since 1954, we can fit a quantile regression on quarterly changes and log EPS on a GDP growth series. Our two GDP paths produce the following EPS paths:
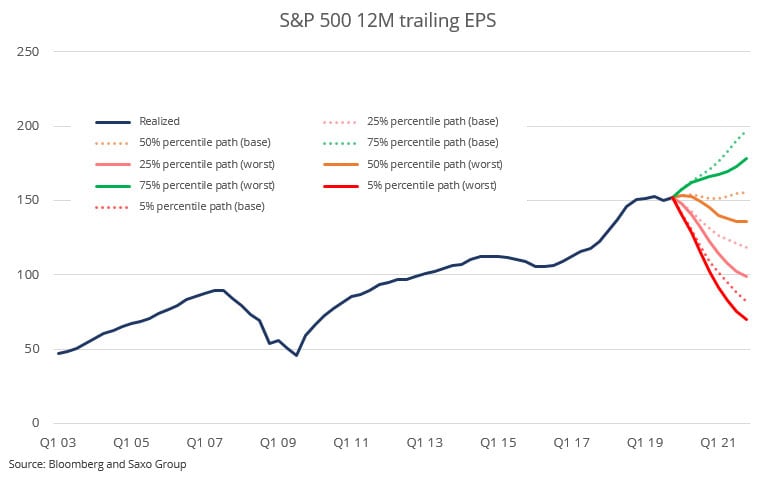
Given all the unknown variables at play in the COVID-19 outbreak, we lean towards the 25% percentile as more likely than the median paths across the two scenarios. If we take the average of the two 2021-ending EPS scenarios for the S&P 500 then we end up at $108.61, which is 28% lower than current earnings. If we assume the P/E ratio declines to 15 — which is reasonable judging from the yield level and previous crisis — then the S&P 500 could hit 1,600. These calculations are not meant to be precise and should not be taken at face value as there is simply too much uncertainty across too many variables. But the exercise is meant to give investors an idea of how bad things go in a worst-case scenario.
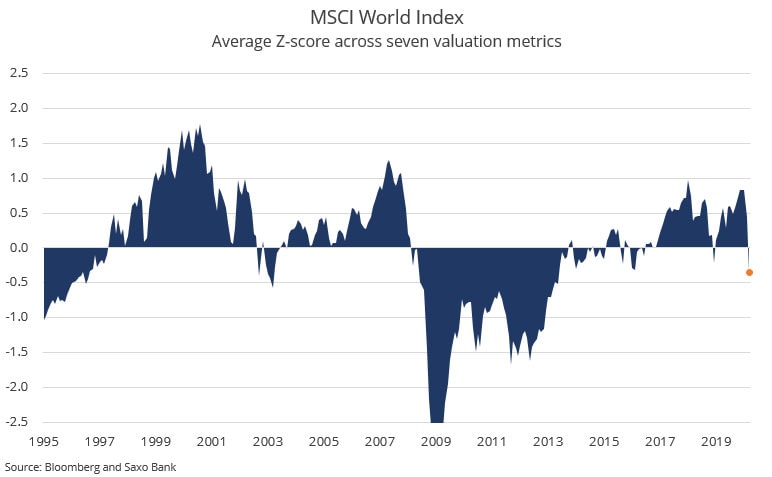
The current drawdown in global equities has taken valuations from 0.84 standard deviation expensive to -0.35 standard deviation cheap, and that’s before the denominator (earnings, sales and cash flows) has even begun to decline. The valuation picture leaves the equity market with plenty of room for further falls. When the global equity market hits -1 standard deviation cheapness then investors should begin to increase their allocation to equities.
We are in the phase where policymakers will throw a lot of stimulus against the economy, including various lending programmes from governments and the extension of tax payments (which is essentially just swapping cash flows over time). With the Fed’s two panic cuts taking the rate to 0.25% all major central banks are now effectively zero bound. Our view is that sentiment and asset prices could be lifted here due to all the stimulus. But then, as economic activity numbers are published investors will realise more is needed and equity markets will take another leg down. Policymakers have a record of always being behind the curve.
Eventually, however, enough stimulus will be added to the economy that equilibrium is reached. At that time, equities will have bottomed.
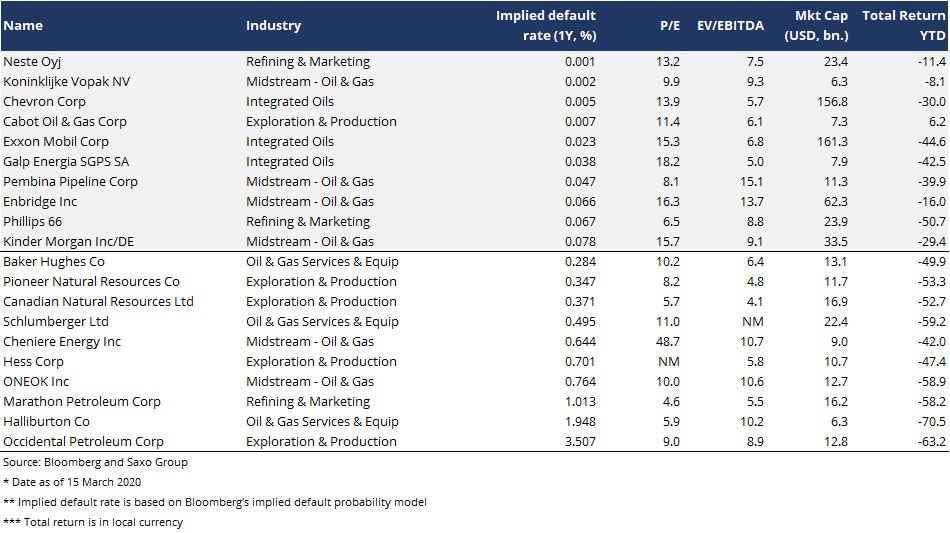
The energy sector is suffering from both a supply and demand shock and an oil price war between Russia and Saudi Arabia, which could push many US shale producers into bankruptcy. Government policies have changed under the current US administration and we cannot rule out bailouts in the US sector to protect jobs and investments in an election year. Among energy companies in North America and Europe, it is the American energy companies that have seen their implied default probabilities rise the most.
The energy sector is structurally weak after years of trying to rebuild profitability and lower debt levels after the oil price collapse of 2014-2015, so it’s inevitable that some companies will disappear. Our view is that investors who want exposure to the energy sector should do it in the strongest energy companies and avoid the weakest (see list for inspiration).
But even after the economy has recovered, the energy sector will have to transition away from fossil fuels — which was the theme in our Q1 Outlook. This means that there will continue to be an ongoing demand pressure for some end products of the oil industry. Our long-term belief is that the oil and gas industry will not deliver excess shareholder value relative to the equity market over the coming decades. The opportunities in the energy sector will be more tactical and more short-term as the economy goes through the business cycle.
The dramatic volatility and declines observed in the first two weeks of March severely impacted 60/40, and risk-parity portfolios will change their asset allocation in the future. With all the major central banks expected to be effectively zero bound in 2020, the scope for returns in bonds will be low for years to come.
As the oil price war and COVID-19 shocks turn into a liquidity and credit crisis — alongside a breakdown of some parts of the ETF market — asset allocators will be forced to consider tail-risks in their approach. But even more importantly, long-volatility components (benefitting when volatility increases) will most likely enter portfolios as these strategies are the only ones that can really protect in these types of crises.
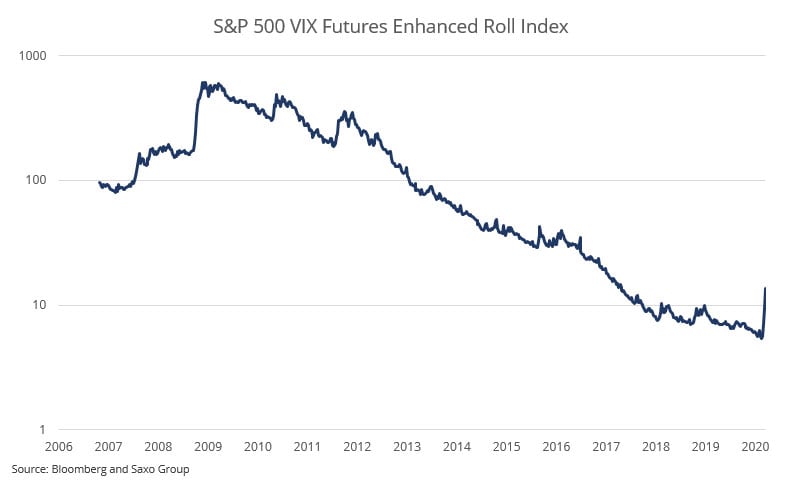
There are many ways to express long volatility, but one is to be long on VIX futures and roll those positions over time. As the VIX forward curve is in contango (upward sloping) there is a negative roll yield to be permanently long this position.
The S&P 500 VIX Futures Enhanced Roll Index shows the P/L of such a position since late 2006. From market bottom in early March 2009 until the week before COVID-19 volatility began, annualised return was -34%. Allocating just 2% of a portfolio to this type of long volatility strategy would create a 0.68% drawdown on annualised return during non-crisis years. In 2008 and during the first weeks of COVID-19 turmoil the 2% exposure would have added 4.7% and 3.1% respectively.
As drawdowns have a disproportionate impact on long-term performance, it does make sense in asset allocation to add a negative expected return stream because of its negative correlation during crises.
Quarterly Outlook
Global Head of Macro Strategy
Quarterly Outlook
Chief Investment Strategist
Quarterly Outlook
Global Head of Investment Strategy
Quarterly Outlook
Global Head of Macro Strategy
Quarterly Outlook
Global Head of Investment Strategy
Quarterly Outlook
Global Head of Macro Strategy
Quarterly Outlook
Chief Investment Strategist
Quarterly Outlook
Head of Commodity Strategy
Quarterly Outlook
Global Head of Macro Strategy
Quarterly Outlook
Global Head of Investment Strategy