
Un seul compte Saxo suffit pour accéder à nos plateformes.

Yields at a 24-year high, equity premium cheaper - Options Brief - 6 October 2026
Options 10 minutes to read

Résumé: The long bond closed at a twenty-four year high and the S&P 500 closed near a record on the same session. One of those two prices is being charged for, and it is not the equity one.
The long end of the Treasury curve posted its highest close in over twenty-four years. Equity option premium got cheaper on the same session.
MARKET REGIME: LOW VOL BULL | VIX 15.52 | TERM STRUCTURE: CONTANGO | SKEW: ELEVATED (143.04) | FRONT-MONTH VIX FUTURES: 17.35
Key findings
- Rates volatility led the board. MOVE rose 5.88% to 113.61, above all 60 of our stored sessions against a median of 76.13.
- Equity premium left the week. Friday’s expiry prices 69.85 points against 87.70 a session ago, where the clock alone leaves about 78.4.
- The index gauge is unremarkable. VIX at 15.52 is within a tenth of its 60-session median; VIX1D at 8.98 is lower than 54 of them.
US Treasury yields rose on Monday and the long end did the work. The thirty-year closed at 5.66%, the highest daily close in over twenty-four years, after touching fresh multi-decade highs intraday and fading back. The ten-year ended near 5.30% while the two-year was close to unchanged around 4.82%, so the curve steepened rather than shifted.
Europe supplied part of the pressure. Spain’s prime minister called a snap election, lifting Spanish yields, while French sovereign stress eased: the German to French ten-year spread widened toward 150 basis points early before ending near 137, down more than four on the day.
The data did not argue against it. The September ISM services survey came in at 54.9 against 55.0 expected, with prices paid rising to 74.0 and employment back above fifty at 50.1.
- US (Monday 5 October close): The S&P 500 rose 0.66% to 7,773.95, near its all-time high, the Nasdaq 100 0.87% to 31,076.44 and the Dow 0.18% to 51,273.12. Breadth was even, the equal-weight index up 0.65%. Nvidia led at 2.12% to a record 238.90, with Tesla 2.20% and Meta 1.90% higher and Apple 0.24% lower.
- Europe: Monday’s closes were mixed. The Stoxx Europe 600 gained 0.36% to 633.63, led by banks, the bank index up 1.40%. The DAX was little changed at 25,254.21, the Euro Stoxx 50 marginally higher at 6,242.15. The CAC 40 fell 0.80% on Schneider Electric.
- Asia (Tuesday morning): The Nikkei 225 is up 0.56% at 70,337 and the Hang Seng 0.78% at 24,228, its technology sub-index up 0.87%. Korea reopened weaker, the Kospi about 1.1% lower near 6,924. Mainland China stays shut.
- Commodities and rates: Brent holds above 100 at 100.76, West Texas Intermediate near 89.72. Gold trades near support just above 4,100, with futures at 4,155.80 and silver near 61.02. The thirty-year yield is 5.66%, the ten-year 5.30% and the two-year 4.82%.
- Market regime: Low volatility bull: VIX 15.52, the cash curve in contango, twenty-day realised volatility 10.23% and rising, the index 1.42% above its fifty-day average.
Source: Saxo, Bloomberg, CBOE. Levels as of the 5 October close unless stated. Yield levels come from the published close, not the export’s change column, which did not reconcile. Past performance is not indicative of future results.
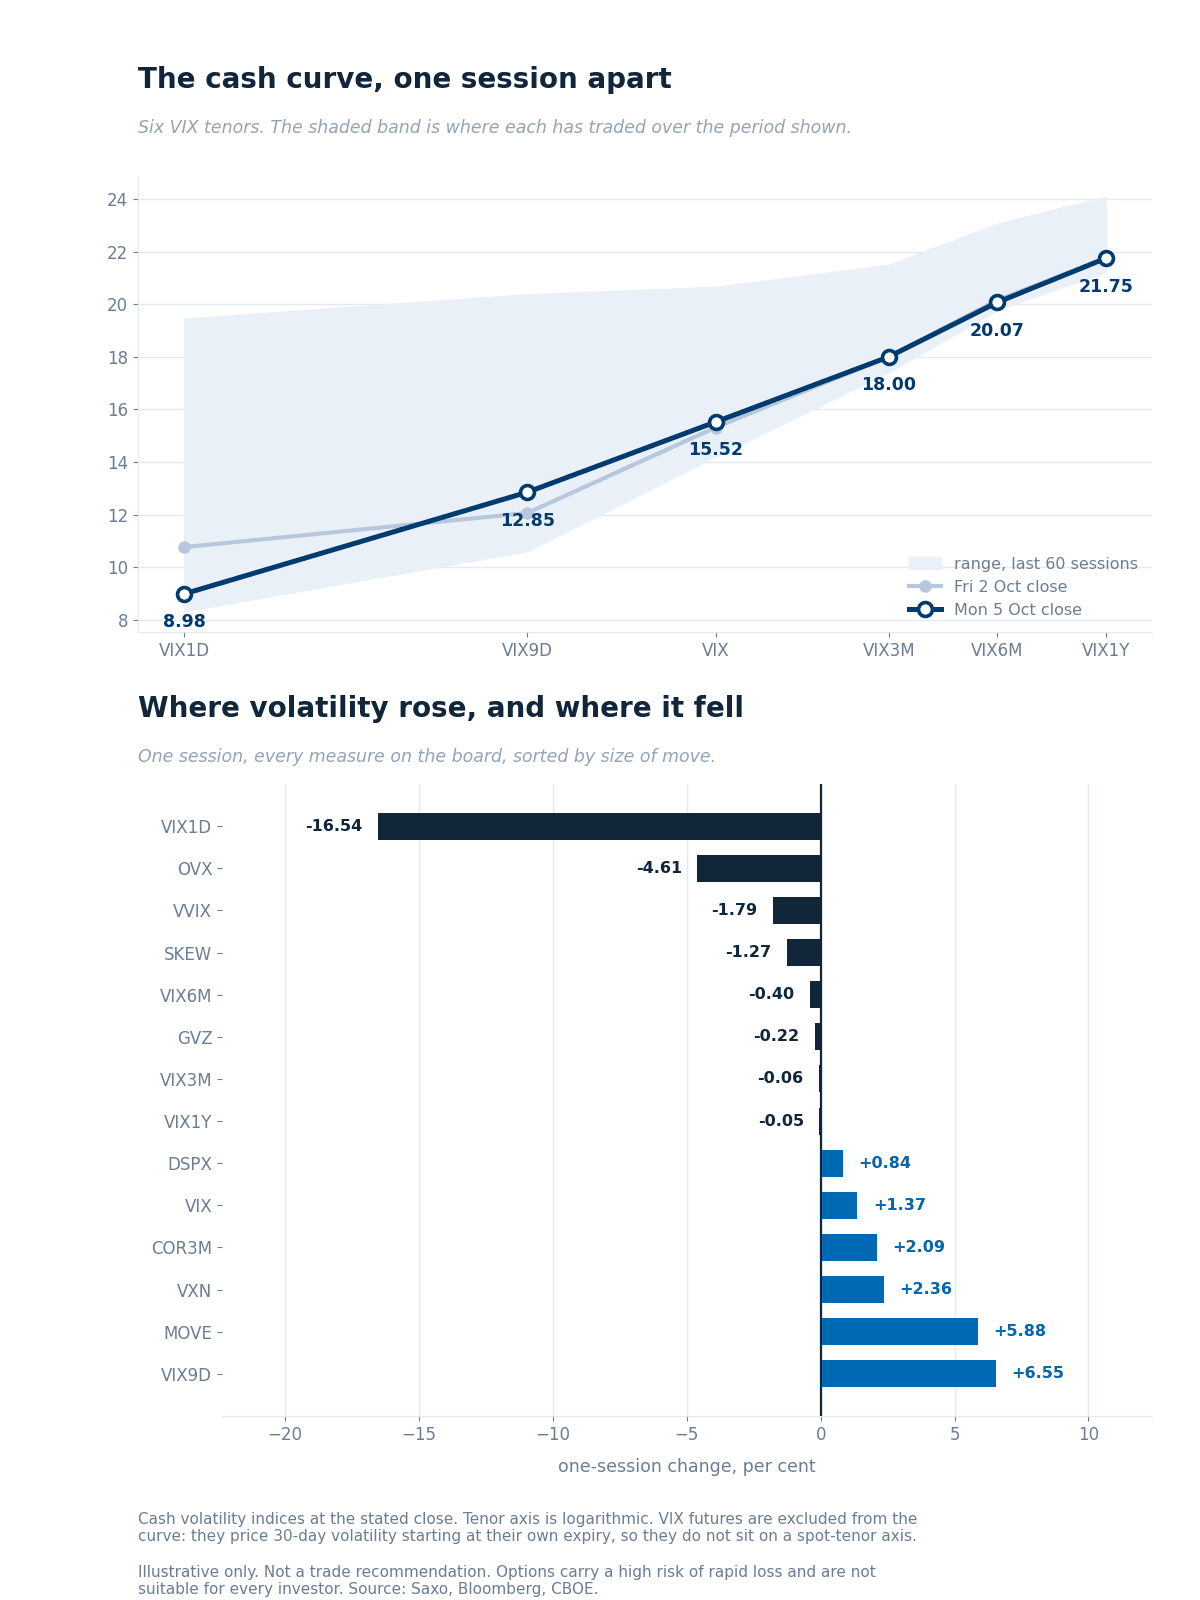 The six cash VIX tenors at Monday’s close against the prior session, over their 60-session ranges.
Reading the curve
- The curve split by tenor. VIX1D fell 16.54% to 8.98 while VIX9D rose 6.55% to 12.85 and the VIX 1.37% to 15.52. VIX3M, VIX6M and VIX1Y finished within a tenth of a point of Friday.
- Rates hold the only extreme. MOVE at 113.61 is above all 60 stored readings against a median of 76.13. Gold volatility at 23.18 is lower than all but four, oil 48.65.
- Ratios the graphic does not carry. VIX3M to VIX is 1.160 against a 60-session median of 1.176, and the Nasdaq-to-S&P ratio 1.398 against 1.422. SKEW eased 1.84 to 143.04, high against a long-run norm nearer 115 though mid-range on its own three months, where 37 of 60 sessions read higher.
VIX futures
- Parity puts the October forward at 17.44 and the November at 18.11, each within 0.09 of its feed, so neither has rolled and the session comparison holds. Both price thirty-day volatility from their own expiry, which is why they sit outside the curve.
- The premium to spot narrowed to 1.92 points from 2.36: the October forward gave back about 0.23 while spot rose 0.21.
Source: Saxo, Bloomberg, CBOE, 6 October 2026, approx. 06:00 CET. Past performance is not indicative of future results.
Saxo’s implied-volatility rank across 186 US and 327 euro-zone option underlyings, where 0 is a one-year low and 100 a high. The universes changed size overnight, so every comparison below is a per-name change rather than a median against a median.
- Rates and credit own the top of the board. The long-bond fund ranks 97.4, the investment-grade credit fund 89.9 and the seven-to-ten year Treasury fund 75.5, on implied volatility of 16.5%, 9.6% and 8.5%. Their ranks rose 5.4, 1.0 and 8.2 points in a session.
- The broad market funds sit at the other end. Grouped, they carry a median rank of 20.6, the lowest of the ten groups the collector tracks, against 75.5 for rates and credit.
- The typical US name is middling. Median rank is 43.7 on a median percentile of 60.3, which is the distinction worth holding: rank measures distance from the year’s extremes, while percentile counts how many days looked like today.
- Health care supplies seven of the US top twenty, Merck at 96.9 and Danaher at 94.0. The Brazil fund went the other way, its rank falling to 46 from a one-year high as the first round of the election passed. See Saxo pricing for costs and charges.
Data source: Saxo, as of 6 October 2026, reflecting the 5 October close. Past performance is not indicative of future results.
Based on end-of-day 5 October, Monday’s positioning and not today’s price action.
Ten reports, one verdict: the session has no readable direction. Every category came back at the same low conviction, size sat in mid-market and paired packages, and the few clean aggressor sides offset each other.
- Single-name flow had no net lean, with the largest confirmed-opening buys pointing opposite ways and the only clear conviction isolated in semiconductors.
- Sector and ETF flow leaned to sellers of volatility wherever a side resolves, with the protection bid effectively absent. Named funds are market context only; see Saxo pricing for costs and charges on exchange-traded fund trades.
What the option market priced for this week, drawn around Friday’s close.
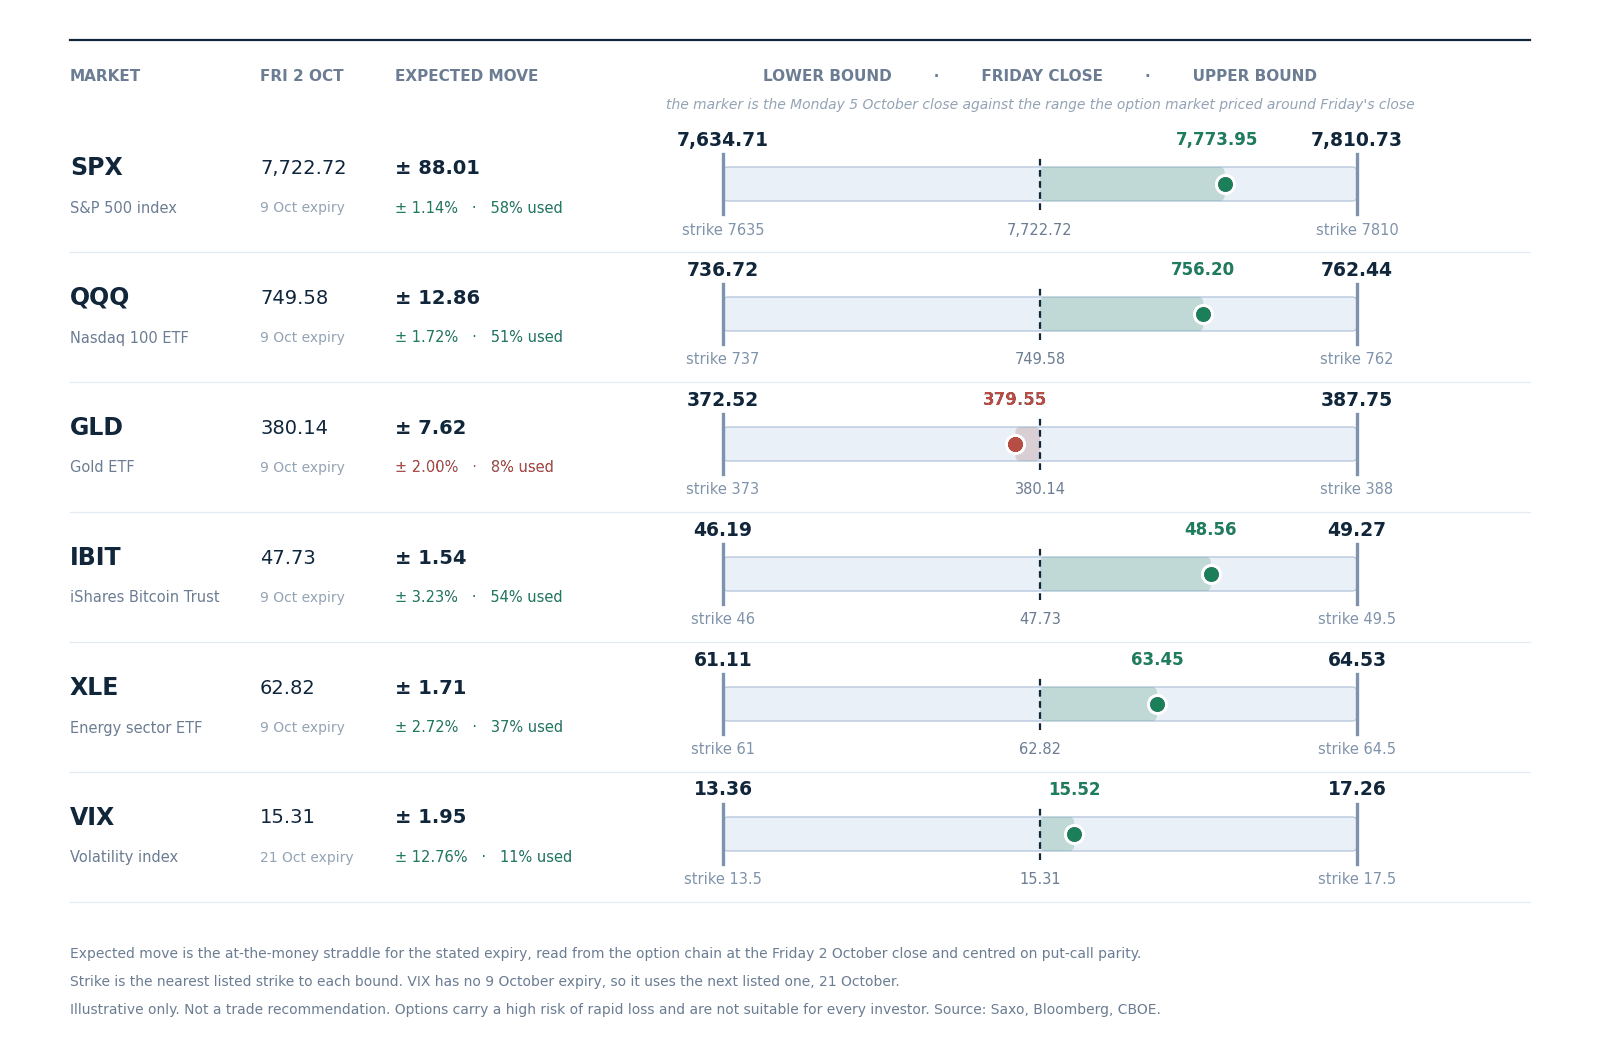 Expected move to Friday 9 October, drawn around the 2 October close with the nearest listed strike at each bound, derived from option-implied pricing. Volatility uses the 21 October expiry, which is the next listed one. Read from the chain at Friday’s close, not a forecast.
- One session has used more than half the index band. The S&P 500 closed Monday at 7,773.95 inside a range of 7,634.71 to 7,810.73, which is 58% of the move priced for the whole week, and it went up to get there.
- The usage split. The Nasdaq 100 fund has used 51% of its band and the bitcoin fund 54%, against energy at 37%, volatility at 11% and gold at 8%.
- Four sessions remain and the upper bound is close. The index sits 36.78 points under its band top of 7,810.73, where the nearest listed strike is 7810.
- Options carry a high risk of rapid loss and are not suitable for every investor; see Saxo pricing for costs and charges.
The US cash session runs 15:30 CET to 22:00 CET. The August trade balance lands at 14:30 CET, before the open, and the Treasury auctions three-year notes at 19:00 CET, three hours inside the session. Bank of Japan governor Ueda spoke at 08:00 CET.
Today’s expiry settles at the 22:00 CET close, so it contains the auction rather than sitting in front of it. That matters more than usual this week: the auction calendar and the Federal Reserve minutes are what the same-morning Quick Take names as the reason rate volatility is bid.
Earnings stay light until Thursday, when PepsiCo, Fast Retailing, Progressive and Tesco report, followed by Delta Air Lines on Friday. Future outcomes are uncertain and may result in losses.
- Session implied move. SPXW options price 31.00 points, or 0.399%, to tonight’s close and 69.85, or 0.899%, to Friday’s, both derived from option-implied pricing. Quotes before the open are indicative.
- What the clock did not explain. Friday’s expiry priced 87.70 points yesterday morning and 69.85 now. Decay alone would have left about 78.4, so roughly 9 points came out beyond the clock.
- Tail risk signal. SKEW eased while the front-month premium to spot narrowed to 1.92 points from 2.36. In our view the market may be charging less for near-dated equity risk even as it pays more for rate risk.
- Correlation read. Implied correlation at 11.72 is higher than 54 of 60 sessions while dispersion at 34.99 sits mid-range. In our assessment index volatility may be held up by correlation rather than by the names.
The thing to watch is whether the two prices meet. Equity options got cheaper inside a week with four sessions left and more than half its priced range unused, while rate volatility went to the top of its three-month range on a day the thirty-year closed at a twenty-four year high.
Those are two readings of the same macro, and in our view one of them may have to move. Options carry a high risk of rapid loss.
Important note: The strategies and examples provided in this article are purely for educational purposes. They are intended to assist in shaping your thought process and should not be replicated or implemented without careful consideration. Every investor or trader must conduct their own due diligence and take into account their unique financial situation, risk tolerance, and investment objectives before making any decisions. Remember, investing in the stock market carries risk, and it’s crucial to make informed decisions.
| More from the author |
|---|